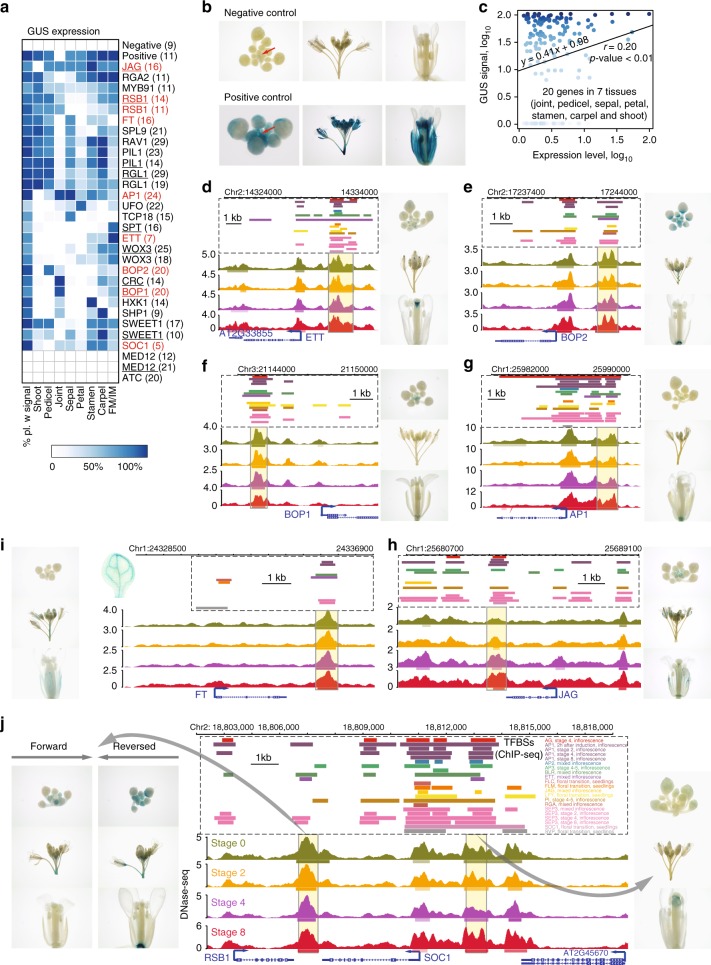
Fig. 4.
Functional validation of predicted enhancers in flower development via GUS reporter assay. a Heatmap showing GUS signals in different flower organs (columns) of T1 transgenic lines transformed with different enhancer constructs (rows). White indicates that no GUS expression was detected in any plants. Blue color intensity refers to the percentage of transgenic plants with detectable GUS expression. Names of genes that are proximal to the candidate enhancers are labeled on the right side and the numbers in parentheses represent the number of independent transgenic lines generated from the construct. Red, examples shown in d–j. Bold, the corresponding enhancer was validated with two independent constructs; underlined, construct that contains a reverse-orientated enhancer fragment. b Pictures of a dissected inflorescence, including a central inflorescence meristem (red arrow) and the surrounding young floral buds, of a whole inflorescence, and of a mature flower (from left to right, respectively) from plants harboring mimial35S as a negative control (left panel) or an enhancer element for a 35S promoter as a positive control (right panel). c Pearson correlation (r) between GUS signals and expression profiles of the corresponding genes in the tested tissues. Tissue-specific gene expression data can be found in Supplementary Data 4. Data points were colored according to the GUS signals in a. d–j Genome browser view of DHS signal profiles as well as called DHS peaks (horizontal bars below the signal profile), and transcription factor binding sites (TFBSs; data from ref. 48) at the genomic region of predicted enhancers (in yellow-background boxes). Pictures of a dissected inflorescence, including a central inflorescence meristem and the surrounding young floral buds, of a whole inflorescence, and of a mature flower (from top to bottom, respectively) on the left or right of the genome browser view represent transgenic lines harboring the corresponding enhancer construct. The proximal genes of selected enhancers showed here are ETT (d), BOP2 (e), BOP1 (f), AP1 (g), JAG (h), FT (i), and RSB1 and SOC1 (j). Color legends for the tracks are indicated in j. Note that the validated enhancers for genes JAG (h), FT (i), and RSB1 or SOC1 (j) are located downstream of the genes. The underlying source data for a and c are provided in the Source Data file

