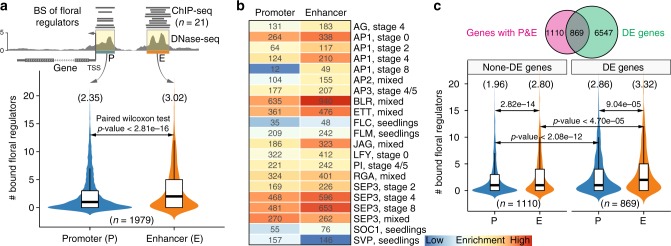
Fig. 5.
Enhancers show more enrichment in binding sites of floral regulators than promoters. a Violin plots (with boxplots inside) showing the number of transcription factor binding sites in promoters (P) and enhancers (E). The above diagram shows the strategy used in the analysis. Only genes with both promoters and enhancers were considered. Twenty one ChIP-seq datasets for 15 floral regulators were included in the analysis (data from ref. 48). The numbers in the parentheses above the plots indicate the average value in each category. Boxplots show the median (horizontal line), second to third quartiles (box), and Tukey-style whiskers (beyond the box). BS binding sites. b Heatmap showing the enrichment of binding sites of different regulators in promoters and enhancers, respectively. Enrichment scores were calculated as log10(p-value) based on hypergeometric tests, using all the annotated protein-coding genes as the background. Numbers indicate the number of proximal genes in each category. c Similar to a, analysis was performed respectively on differentially expressed (DE) genes and non-DE genes during flower development. The Venn diagram above shows significant overlap (hypergeometric test, p-value < 1.92e–64) between genes having promoters/enhancers and genes exhibiting differential expression. The underlying source data for a and c are provided in the Source Data file

