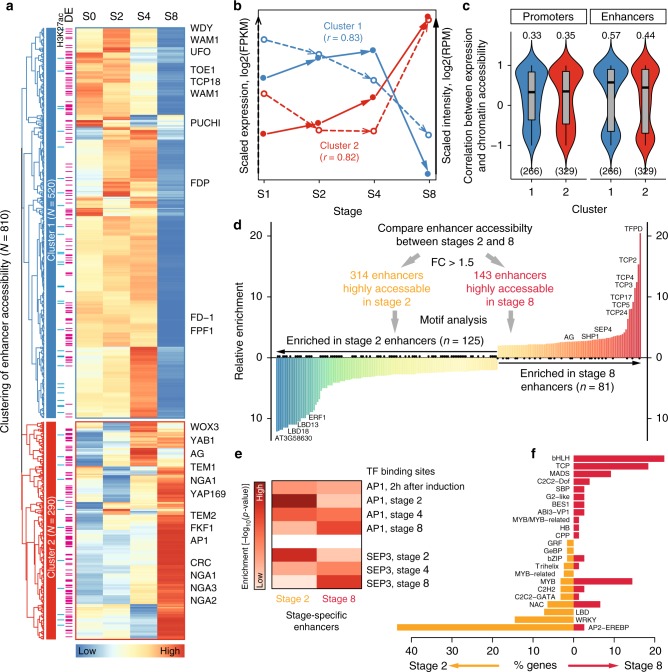
Fig. 6.
Enhancers control developmental stage-specific gene expression programs. a Heatmap illustrating the clustering analysis of 810 enhancers whose accessibility dynamically changes for more than 1.5-fold across the four stages (from stages 0 [S0] to 4 [S4]). The enhancers are grouped into two clusters. The blue bars on the left of the heatmap indicate that there are H3K27ac peaks for the corresponding enhancers. Pink bars indicate that the nearest genes are differentially expressed (DE). Flowering genes are labeled on the right of the heatmap. b The median expression level (in dashed arrow) and enhancer accessibility (in solid arrow) across developmental stages for the genes from the two clusters in a. Pearson correlation coefficients r between gene expression and enhancer accessibility for each cluster are shown in parentheses. c Violin plots (with boxplots inside) showing the Pearson correlation coefficient between expression level and chromatin accessibility for each gene in different clusters. Promoters with respect to the enhancers in each cluster were used for comparison. The median correlation coefficient is shown above the violin plot. The number of genes used in the analysis is indicated in parentheses. Note that genes with missing expression data were removed from the analysis. d Identifying stage-specific enhancers at stages 2 and 8. Histogram shows enriched motifs in the stage-specific enhancers. Only motifs showing at least twofold changes in enrichment between stages 2 and 8 are plotted. e Enrichment analysis of AP1 and SEP3 binding sites (time-course ChIP-seq data from refs. 18,72) in stage-specific enhancers. Heatmap shows log10-transformed p-values from hypergeometric tests. f Overview of TF families for TF genes with enriched motifs as shown in d. The underlying source data for a–f are provided in the Source Data file

