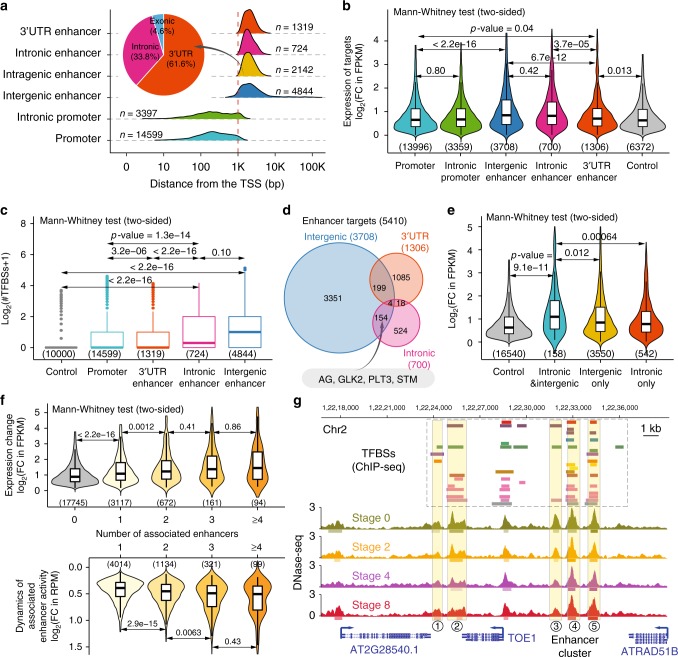
Fig. 7.
Intragenic enhancers and enhancer clusters. a Distribution of the distance of cis-regulatory elements from the TSS. Inset pie chart depicts the genomic context of intragenic enhancers. The number of elements in each category is indicated. b Violin plots (with boxplots inside) showing expression dynamics of predicted target genes. The y axis is the highest log2-transformed fold change (FC) of expression levels (in FPKM) during flower development. The number of predicted target genes in each category is shown in parentheses. c Boxplots showing the distribution of the number of transcription factor binding sites (TFBSs; data from ref. 48) overlapping with cis-regulatory elements in each category. In the analysis, 10000 random genomic regions are used for control. Boxplots show the median (horizontal line), second to third quartiles (box), and Tukey-style whiskers (beyond the box). d Venn diagram showing the overlap of target genes for intergenic and intragenic enhancers. Example genes with both intergenic and intronic enhancers are shown in the box below. The total number of genes in each category is shown in parentheses. e Violin plots (with boxplots inside) showing expression dynamics of target genes with intergenic enhancers only, with intronic enhancers only, and with both intergenic and intronic enhancers. Genes without any enhancers are used for comparison. f Violin plots (with boxplots inside) showing expression changes of target genes (top panel) or the change of enhancer activity (in RPM, calculated based on chromatin accessibility/DNase-seq data; bottom panel) over the four developmental stages with increasing number of associated enhancers. Only intergenic and intronic enhancers were considered. The number of enhancers (bottom) and predicted target genes (top) in each category is labeled in parentheses. Genes without any enhancers are used for comparison. b, c, e, f Boxplots show the median (horizontal line), second to third quartiles (box), and Tukey-style whiskers (beyond the box). BS binding sites. g Genome browser view of annotated enhancers at the locus of TOE1. Putative enhancers are numbered. Please note that the fifth enhancer could belong to the next gene ATRAD51B based on genomic distance. See Fig. 4j for the color code of tracks. The underlying source data for a–c and e, f are provided in the Source Data file

