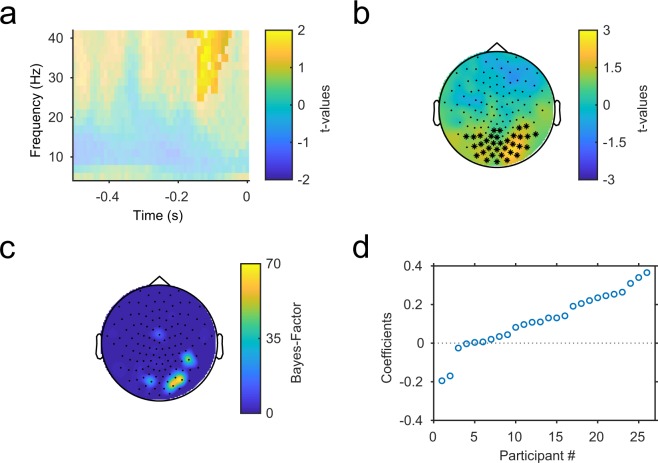
Figure 2.
(a) Time frequency spectrum of t-values for the comparison of observed regression weights against dummy data, averaged over the significant channels. Significant regions are indicated by saturation. (b) Topography of t-values, averaged over the significant time-frequency region. Significant channels are marked by asterisks. (c) Topography of Bayes-Factor values, averaged over the significant time-frequency region. (d) Individual regression coefficients, averaged over the significant cluster. Participants are sorted in ascending order of the coefficient.

