Figure 2.
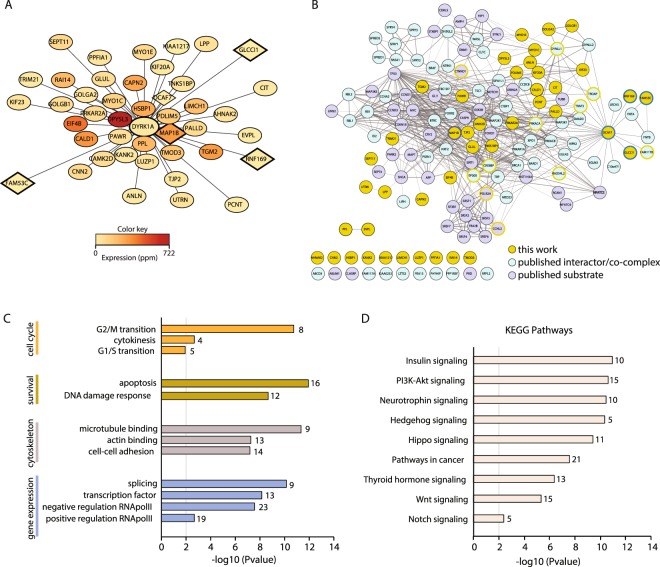
The DYRK1A interactome. (A) The high confidence DYRK1A interactors from WT HeLa vs HeLa-DYRK1AKO cells were visualized using Cytoscape: the distance to the bait represents the inverse of the enrichment score (ES, the mean of all AP-MS experiments; the less enriched interactors are located further away from the bait) and the color of the node reflects the abundance of the protein in HeLa cells according to PaxDb (dataset 9606/455). Only proteins identified using at least two antibodies in Fig. 1C are shown. Proteins already known as DYRK1A substrates/interactors are squares. (B) Network of all DYRK1A interactors (blue), substrates (violet) and the proteins shown in panel A (orange). The list of DYRK1A interactors and substrates was curated manually (Supplementary Dataset 3). The DCAF7 dataset of interactors was obtained from BioGRID. The network was visualized using Cytoscape and the edge thickness and grey scale indicate the confidence level of the data based on the combined STRING score. Proteins identified in our screen but previously found as interactors or substrate were circled in blue or violet, respectively. Proteins in the network that were found in our screen below the established thresholds are circled in orange. (C,D) Analysis of the DYRK1A network for Gene Ontology enrichment (C) and KEGG signaling pathways (D) according to the DAVID software. The graphs show p-values (y-axis) and the number of proteins in each set.

