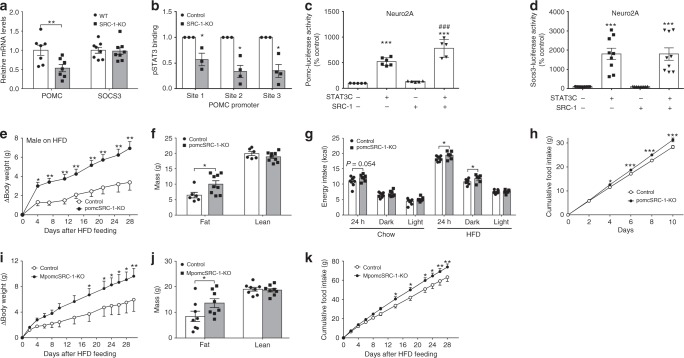
Fig. 1.
SRC-1 potentiates STAT3-induced Pomc expression. Numbers of mice/repeats in each group are indicated; data are presented as mean ± SEM and compared using T-tests or two-way ANOVA followed by post hoc Sidak tests (#). a Pomc and Socs3 mRNA levels in hypothalami from 16-week old SRC-1-KO and WT control littermates (n = 7/8); **P < 0.01. b ChIP assays detecting pSTAT3 binding on Pomc promoters in hypothalami from male SRC-1-KO and control littermates 30 min after leptin injections (5 mg/kg, i.p.): site 1, −998 to −989; site 2, −361 to −353; site 3, −76 to −68 upstream of Pomc (n = 3/4); *P < 0.05. c, d Effects of overexpressed constitutively active STAT3 and SRC-1 on Pomc- (c) or Socs3-luciferase activity (d) in Neuro2A cells (n = 5–9 independent experiments). ***P < 0.001 vs. empty vectors; ###P < 0.001 vs. STAT3 alone (#). e Change (∆) in body weight after male control and pomcSRC-1-KO mice were switched onto a HFD at day 97 (n = 6/9); *P < 0.05 and **P < 0.01 (#). f Fat mass and lean mass measured 28 days after HFD feeding (n = 6/9); *P < 0.05. g Energy intake measured by CLAMS chambers in 12-week old male mice matched for body weight, lean mass, and fat mass. Mice were subjected to a 2-day-chow–2-day-HFD protocol, and chow was replaced by HFD before the onset of dark cycle on day 3. Energy intake was averaged for 2-day chow feeding period and for 2-day HFD feeding period (n = 7/8); *P < 0.05. h Cumulative HFD intake measured in 12-week old male mice singly housed in home cages (n = 10/14); *P < 0.05 (#). i Change in body weight after control and MpomcSRC-1-KO mice were switched on a HFD at the age of day 84 (n = 8); *P < 0.05 (#). j Fat mass and lean mass measured 30 days after HFD feeding (n = 8); *P < 0.05. k Cumulative HFD intake measured in 12-week old male mice (n = 6/7); *P < 0.05 (#), **P < 0.01. Source data are provided as Source Data Fig. 1

