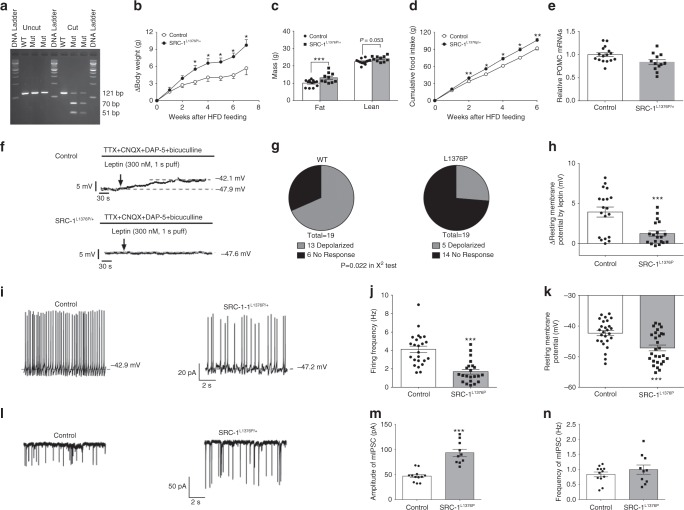
Fig. 4.
SRC-1L1376P/+ mice are obese. Numbers of mice in each group are indicated; data are presented as mean ± SEM and compared using T-tests or two-way ANOVA followed by post hoc Sidak tests (#). a The PCR products (121 bp) around the L1376 were amplified from genomic DNA extracts of a WT and two SRC-1L1376P/+ mutant mice and incubated with or without Sau3AI. Control reaction (WT) resulted in a single large fragment (121 bp) and DNAs from the two SRC-1L1376P/+ mutant mice were cut into two fragments (70 and 51 bp) as expected. b Change in body weight after male control and SRC-1L1376P/+ mice were fed on a HFD (n = 5/6); *P < 0.05 (#). c Fat mass and lean mass measured 7 weeks after HFD feeding (n = 5/6); ***P < 0.001. d Cumulative HFD intake measured (n = 5/6); *P < 0.05 or **P < 0.01 (#). e Pomc mRNA levels in hypothalami from 20-week old HFD-fed male control and SRC-1L1376P/+ mice (n = 12/16); *P < 0.05. f Representative traces of leptin-induced depolarization, in the presence of TTX, CNQX, DAP-5, and bicuculline, in Pomc neurons from control mice vs. from SRC-1L1376P/+ mice after 1-week HFD feeding. g Responsive ratio (depolarization is defined as >2 mV elevations in resting membrane potential) (n = 19); P = 0.022 in χ2 tests. h Quantification of leptin-induced depolarization in two groups (n = 19); ***P < 0.001. i Representative traces of action potentials in untreated Pomc neurons from control mice vs. from SRC-1L1376P/+ mice. j, k Quantification of firing frequency (j) and resting membrane potential (k) in two groups (n = 22–28); ***P < 0.001. l Representative traces of mIPSC in untreated Pomc neurons from control mice vs. from SRC-1L1376P/+ mice. m, n Quantification of amplitude (m) and frequency (n) of mIPSC in two groups (n = 10/12); ***P < 0.001. Source data are provided as Source Data Fig. 4

