Figure 2.
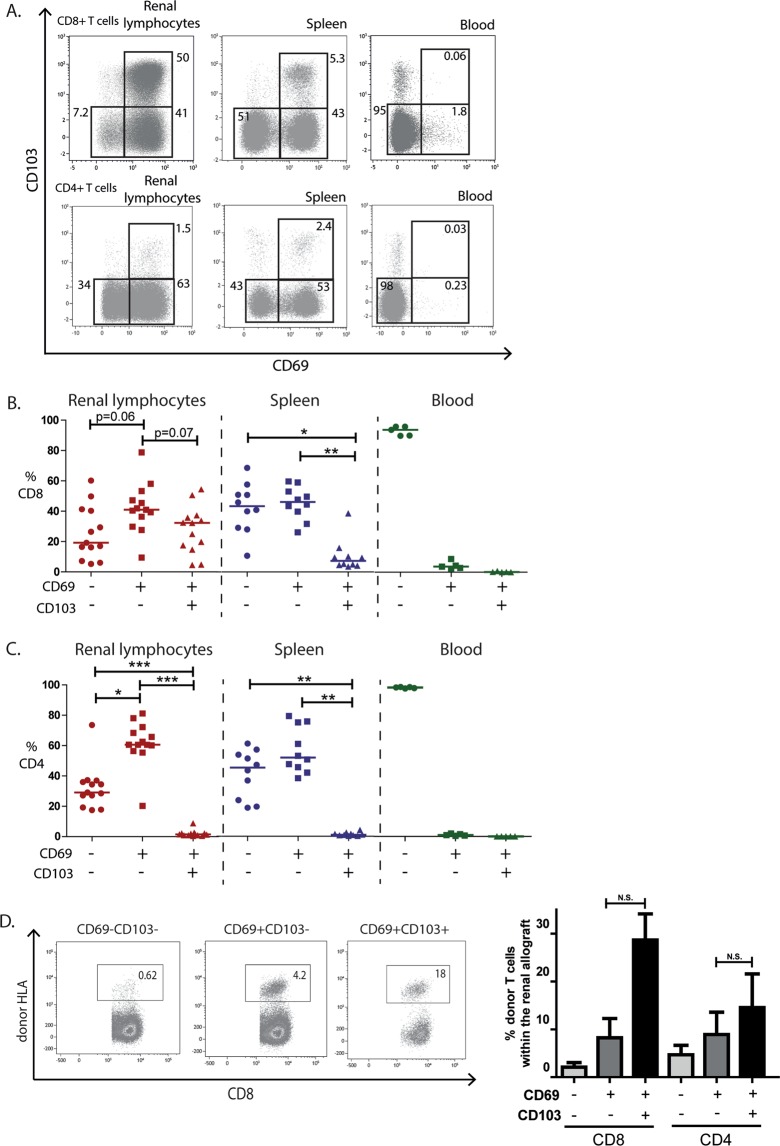
TRM cells are present within CD8+ and CD4+ T cells in the renal allograft. Lymphocytes from rejected renal allografts, spleens of organ donors, and blood from healthy individuals were stained with mAb against CD69 and CD103. (A) Representative examples of the gating strategy of CD69 and CD103 of lymphocytes originating from the renal allograft, spleen, and blood. Proportions of the gated areas are depicted within the dot-plots. (B,C) Quantified data of the recirculating T cells (CD69−CD103−), CD103− TRM cells (CD69+CD103−), and CD103+ TRM cells (CD69+CD103+) subsets within the CD8+ T cell compartment (B) and CD4+ T cell compartment (C) of the renal allograft, spleen, and blood (blood n = 5, spleen n = 10, renal allograft n = 13). Frequencies of the cells are presented as individual proportions with medians. Significant differences were calculated and presented (*p < 0.05, **p < 0.01, ***p < 0.001). (D) mAb against HLA class I antigens were used to discriminate between donor and recipient lymphocytes. Typical example dot plots and quantified data of proportions of donor-derived cells within the CD103+ TRM cells, CD103− TRM cells and recirculating T cells are depicted of the transplant nephrectomies removed within the first month after transplantation (Table 1, patient 1 to 3). Frequencies of the positive cells are depicted within the dot plots. Frequencies of positive cells are shown as mean with the SEM (n = 3; N.S. = not significant).

