Figure 4.

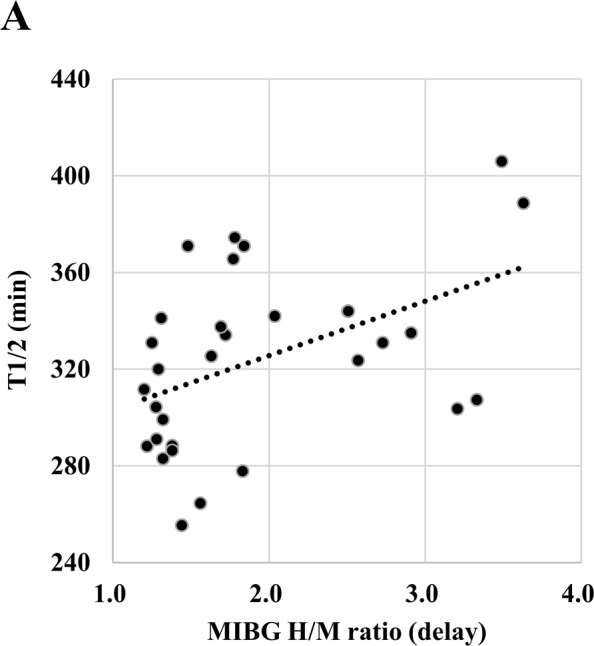
Correlation between HANABI kinetics and the MIBG H/M ratio. Dot plot of T1/2 and the MIBG H/M ratio of patients with PD. There was a positive correlation between both parameters (ρ = 0.405, p = 0.019, Spearman correlation test).

Correlation between HANABI kinetics and the MIBG H/M ratio. Dot plot of T1/2 and the MIBG H/M ratio of patients with PD. There was a positive correlation between both parameters (ρ = 0.405, p = 0.019, Spearman correlation test).