Fig. 2.
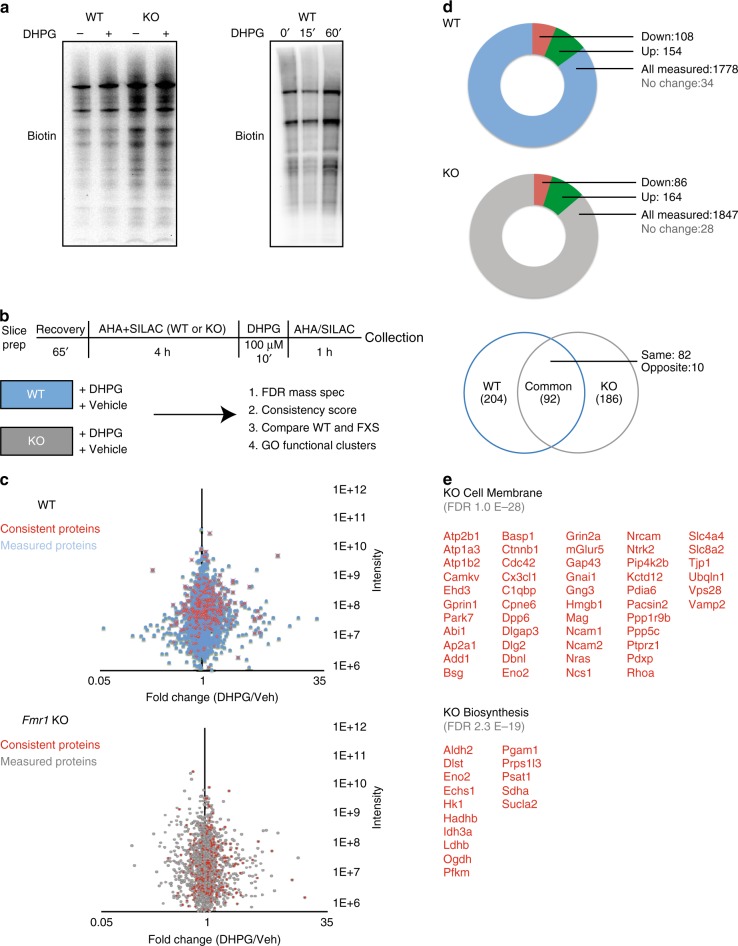
mGluR-stimulated de novo proteome differs in the hippocampus of wild-type and Fmr1 knockout mice. a Example western blot image of BONCAT labeling of biotinylated de novo proteins made in wild-type (WT) and Fmr1 knockout (KO) hippocampal slices in response to the group I mGluR agonist DHPG (left panel, n = 3 WT with slices split evenly between Veh and DHPG, n = 3 KO with slices split evenly between treatments, p = 0.04; WT Veh vs WT DHPG, p = 0.06 WT Veh vs KO Veh, p = 0.32 KO Veh vs KO DHPG). In keeping with previous reports, no appreciable change in labeling was observed seen in KO slices stimulated with DHPG. (right panel). Sample western blot of time course of DHPG-induced de novo protein synthesis (right panel, n = 3 0′ and 60′, p = 0.05, Student’s t-test, n = 2 for 15′ timepoint). b Schematic timeline and workflow of the BONLAC experiment. c Screens were performed for WT and KO separately. Both followed the same workflow and processing and were done on successive days from same batch of litters. Fold change vs intensity distribution plot of all detected proteins in WT +/− DHPG (top) or KO +/− (bottom) hippocampal proteome in blue and gray respectively (n = 9 WT Veh, n = 9 WT DHPG, n = 8 KO Veh, n = 8 KO DHPG divided in 3 biological replicate groups per treatment condition per genotype). Overlay with red scatter plot depicts candidate proteins that were consistently altered using cut-offs derived from C-score rank score algorithm. n = 3 MS runs for 3 mice per genotype, per condition, per run. d Pie-chart breakup of total number of proteins measured across all runs and consistently upregulated and downregulated candidates from WT and KO screens (top and middle panel). Venn diagram depicting overlap in candidate identities between WT + DHPG and KO + DHPG screens (bottom panel). e Top Gene Ontology candidates in KO DHPG screen in Cell Membrane and Biosynthesis categories from DAVID 6.8

