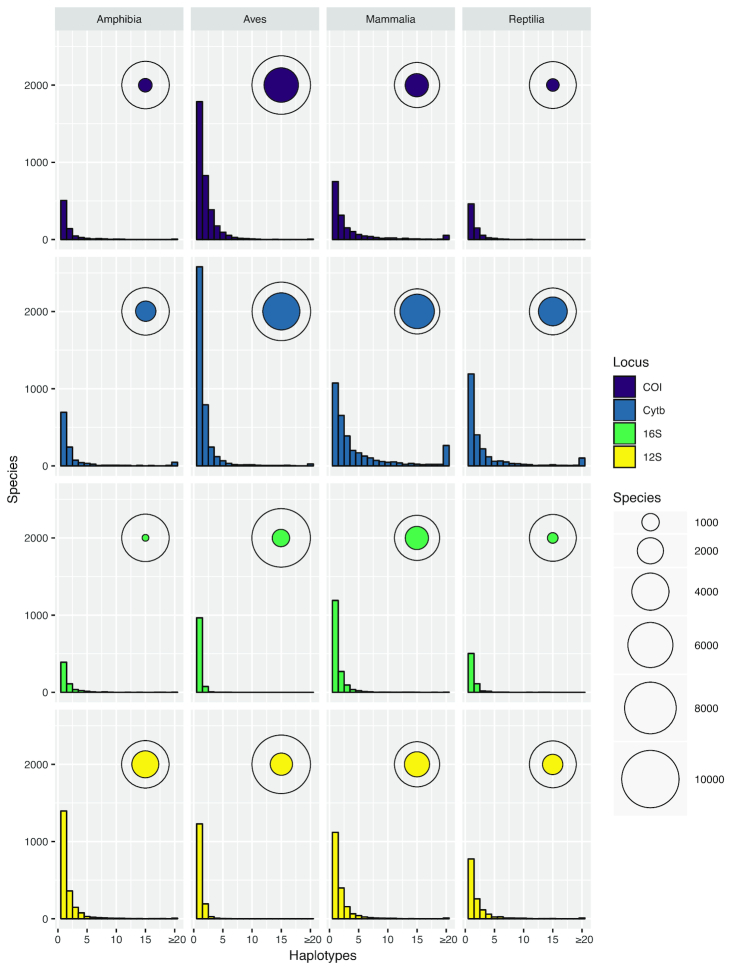
Figure 5:
Haplotype number by species (frequency distribution) and the total number of species with ≥1 haplotype, shown relative to the total number of species in the taxonomy for that category (bubbles), shown for each marker and class of Tetrapoda. The proportion of species covered by the database varies between categories, but in all cases a majority of recovered species are represented by a single unique haplotype.

