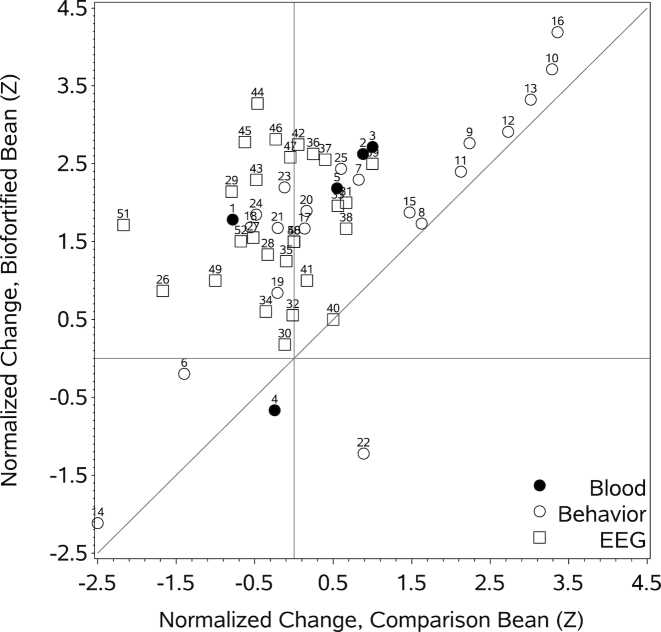
FIGURE 2.
Normalized (Z-unit) change scores for each of the 3 classes of dependent variables (blood, behavior, and EEG) for the participants in the biofortified bean treatment condition relative to those in the comparison bean treatment condition. Numbers above each of the plot symbols refer to the variable numbers in Supplemental Table 1.

