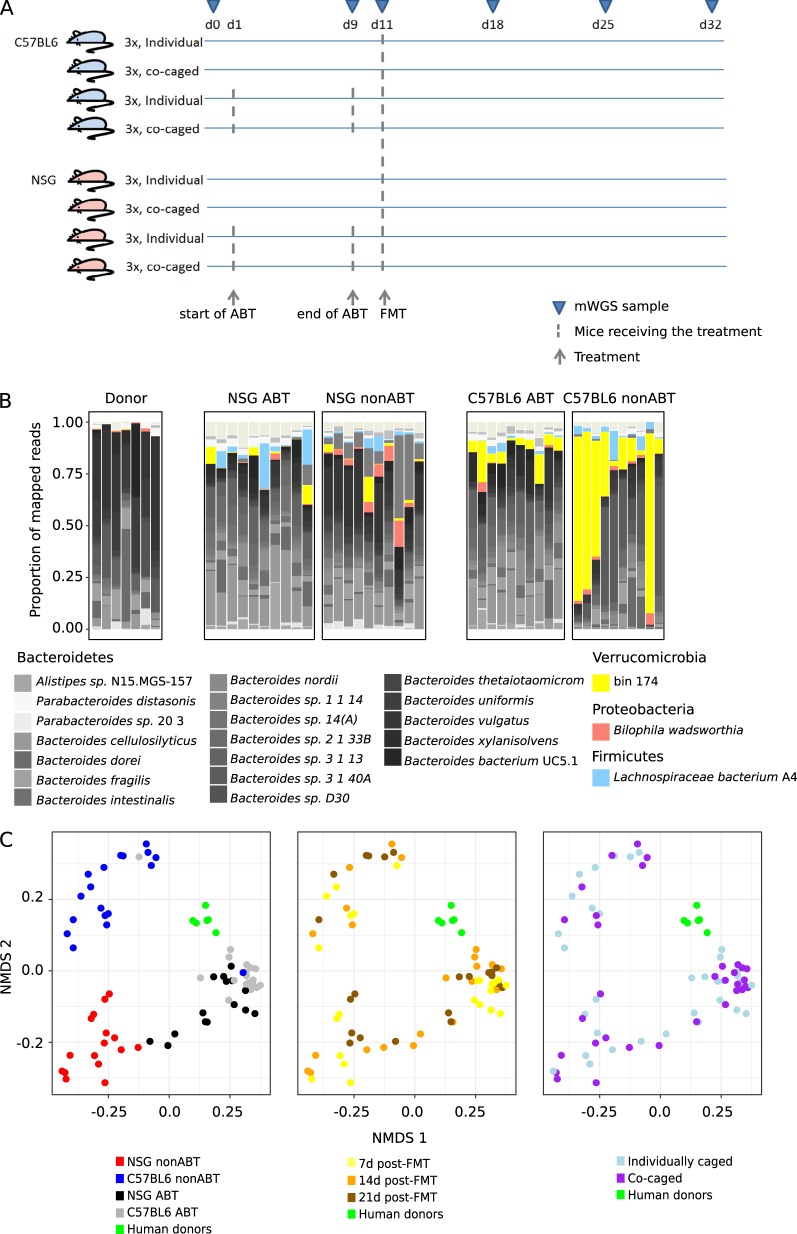
Fig. 2.
Compositional profiling of the FMT-established microbial communities. a The timeline of treatments and data collection. b The proportion of reads from mice that had received human FMT mapped to the most abundant microbial species. Here, “species” refers to both microbial species in panDB and the high-quality genome bins. 10 randomly chosen mWGS samples (i.e., random engraftment time and caging) were shown for each type of mouse gut environment. c Multidimensional scaling of pairwise Bray–curtis dissimilarities of the FMT-established microbial communities. Samples are grouped and color coded based on host, gut conditions, time post-FMT, and caging. The two axes explained 42.5% of the total variance

