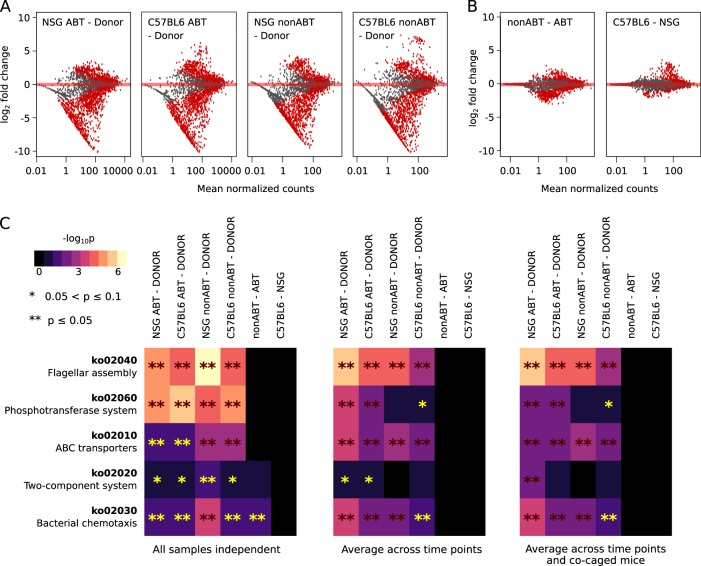
Fig. 5.
Functional genes and pathways enriched in the successful colonizers of different mouse gut environments. a MA plot (log fold change versus mean normalized counts) showing the difference in KEGG ortholog abundances in the successful colonizers compared to the human donor samples. KEGG orthologs with significantly different abundances were shown in red (Benjamin–Hochberg adjusted p < 0.05). As an example, all samples were treated as independent. b MA plot showing KEGG orthologs enriched in the successful colonizers of the nonABT mice compared to ABT mice and of the C57BL6/J mice compared to NSG mice. KEGG orthologs with significantly different abundances were shown in red (Benjamin–Hochberg adjusted p < 0.05). As an example, all samples were treated as independent. c Differentially abundant KEGG pathways in the successful colonizers. Benjamin–Hochberg adjusted p-values were shown for different sample pooling strategies: panel 1—all samples were treated as independent (no pooling), panel 2—samples representing time points of a same mouse were combined, and panel 3—samples representing time points of all mice in a same cage were combined. Differentially abundant KEGG pathways were compared between successful colonizers and the original human samples (first four columns of each panel), between successful colonizers of the nonABT and ABT mice (column five of each panel) and between successful colonizers of the C57BL6/J and NSG mice (column six of each panel)

