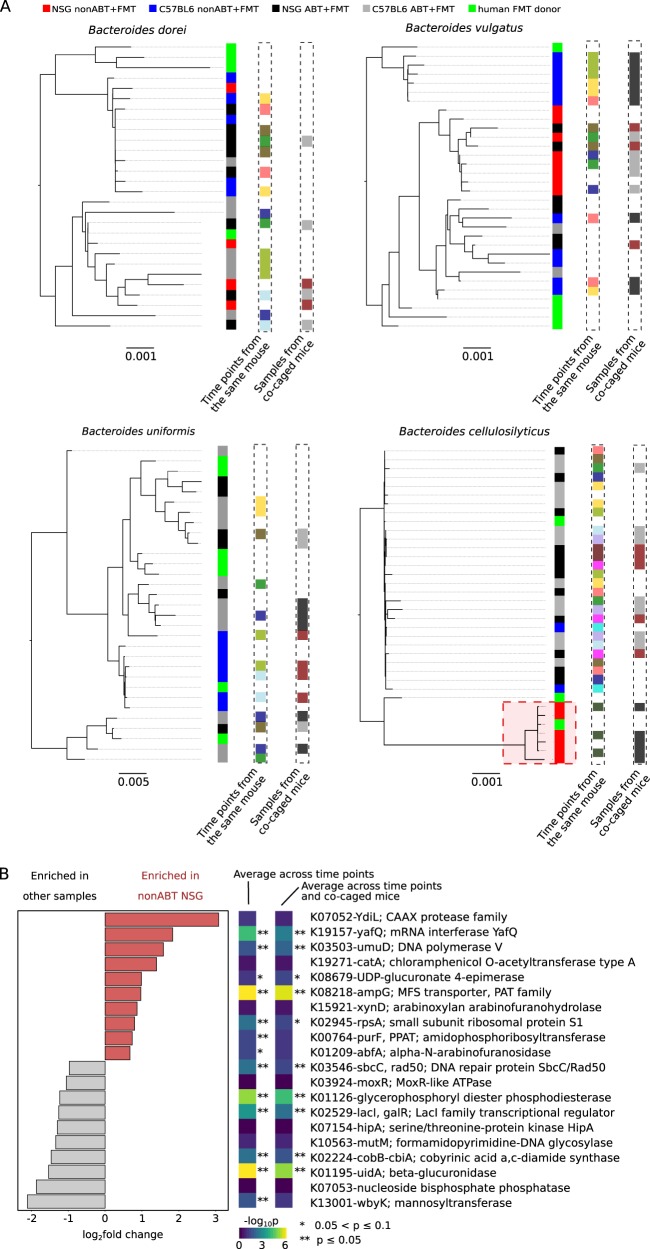
Fig. 7.
Selection on conspecific strains by the mouse gut environments. a Maximum-likelihood phylogeny of the reconstructed strain haplotypes. Each strain is color coded by its host condition (the first column to the right of each phylogeny). Additionally, strains sharing the same color code (white not included) in columns labeled with “time points from the same mouse” or “samples from co-caged mouse” were reconstructed from samples representing time points from a same mouse or co-caged mice, respectively. A distinct cluster of B. cellulosilyticus strains that were exclusively dominant in the nonABT NSG mice were highlighted in a red square. b B. cellulosilyticus accessory genes that had significantly higher or lower abundances in the nonABT NSG mice. Top 10 enriched or depleted genes with the largest fold changes were shown; all genes satisfied Benjamin–Hochberg adjusted p < 10−5 when all samples were treated as independent. Additionally, the Benjamin–Hochberg adjusted p-values were also shown with different sample pooling strategies: “average across time points”—samples representing time points of a same mouse were combined, “average across time points and co-caged mice” —samples representing time points of all mice in a same cage were combined

