Fig. 1.
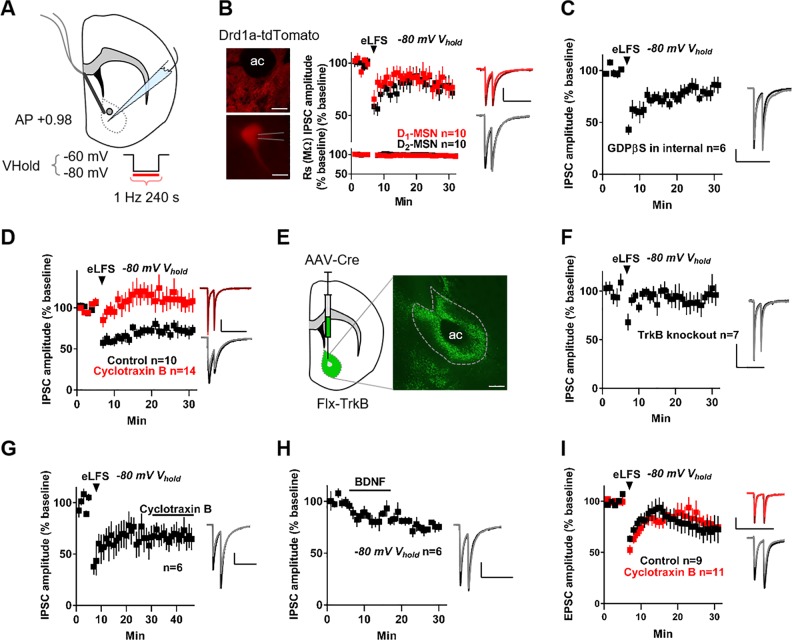
Nucleus accumbens long-term depression of inhibitory synapses (NAc-iLTD) is tropomysin receptor kinase B (TrkB)-dependent. a Schematic representing the experimental configuration. b Left top: tdTomato expression under the Drd1a promoter. Left bottom: Representative patch onto a dopamine D1-receptor expressing medium spiny neuron (MSN). Scale bars: 125 µm top and 20 µm bottom. Right top: Electrical low-frequency stimulation (eLFS) delivered while voltage-clamping (Vhold) D1- (red) and putative D2-dopamine receptor expressing (black) MSNs in the down state (Vhold = −80 mV) induced NAc-iLTD. Right bottom: NAc-iLTD in D1-expressing MSNs and D2-expressing MSNs was not due to changes in series resistance (Rs). c Inclusion of GDP-β-S (500 µM) in the internal pipette solution did not eliminate NAc-iLTD. d Bath application of the TrkB antagonist, cyclotraxin B (2 µM) eliminated NAc-iLTD expression (red) compared to control conditions (black). e Left: Schematic of the experimental condition. Right: Expression of cre-recombinase in the NAc in floxed-TrkB mice (eGFP). Dashed line depicts the location of the NAc core. Scale bar: 250 µm. f Conditional deletion of TrkB from the NAc eliminated NAc-iLTD expression. g NAc-iLTD was stable; applying cyclotraxin B (2 µM) after NAc-iLTD induction did not return inhibitory postsynaptic current (IPSC) amplitudes to baseline. h Acute application of exogenous brain-derived neurotrophic factor (BDNF, 4 nM) depressed inhibitory synaptic transmission onto MSNs while voltage-clamping MSNs at −80 mV. i eLFS delivery while voltage clamping MSNs at −80 mV depressed excitatory transmission onto MSNs (black). This excitatory LTD was not TrkB dependent (red, 2 µM cyclotraxin B). Insets: Representative traces of the first 5 min (dark) and final 5 min (light) of the experiment. Scale bars for traces: 200 pA, 200 ms. EPSC excitatory postsynaptic current; AP anterior/posterior; ac anterior commissure. Data are represented as mean ± SEM

