Fig. 4.
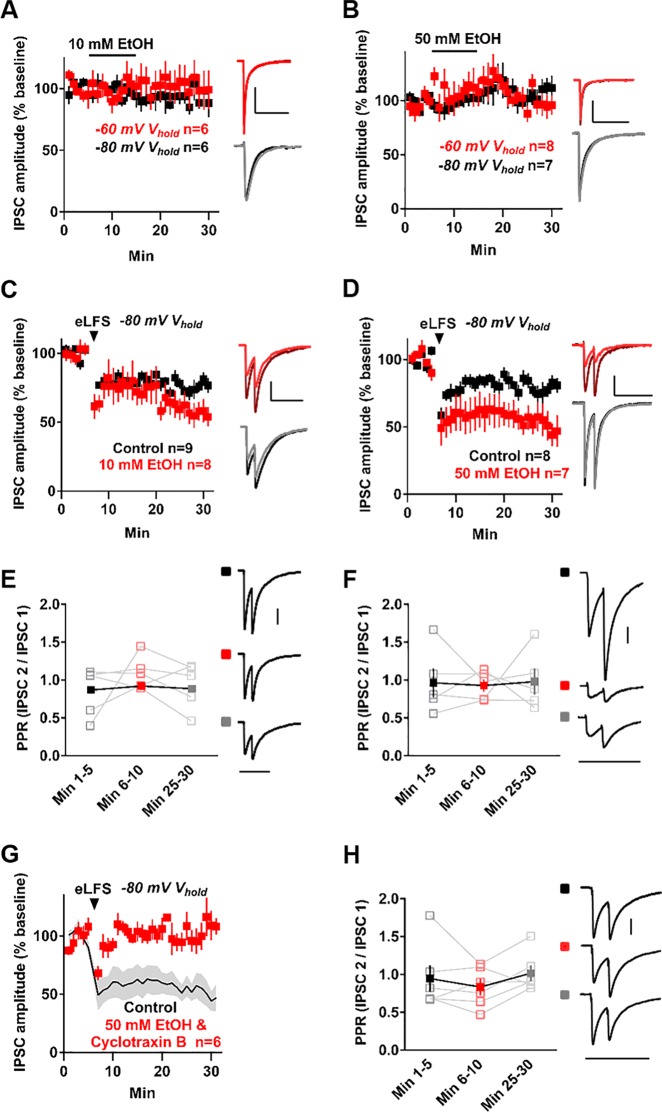
Ethanol (EtOH) enhances NAc-iLTD. a Acute application of 10 mM EtOH did not depress synaptic inhibition onto MSNs when voltage clamped at −60 mV (red) or −80 mV (black). b Acute application of a higher dose of EtOH (50 mM) did not depress inhibitory transmission onto MSNs when voltage clamped at either −60 mV (red) or −80 mV (black). c Incubating slices in 10 mM EtOH enhanced NAc-iLTD (red) compared to control aCSF (black). d The presence of a higher concentration of EtOH (50 mM) in the aCSF enhanced the magnitude of NAc-iLTD (red) compared to control aCSF (black). e Left: The mean PPR was not different at any time point following NAc-iLTD induction in the presence of 10 mM EtOH. Right: Representative traces for each time point. f Left: The mean PPR was not significantly different between any time point following NAc-iLTD induction in the presence of 50 mM EtOH. Right: Representative traces for each time point. g 50 mM EtOH-enhanced NAc-iLTD is eliminated in the presence of cyclotraxin B (2 µM, red). Black line (±SEM, gray) represents the 50 mM EtOH-induced enhancement of NAc-iLTD from d. h Left: The mean PPR was not significantly different between any time point following NAc-iLTD induction in the presence of 50 mM EtOH and cyclotraxin B. Right: Representative traces for each time point. Insets: Representative traces of the first 5 min (dark) and final 5 min (light) of the experiment. Scale bars: 200 pA, 200 ms. Data are represented as mean ± SEM

