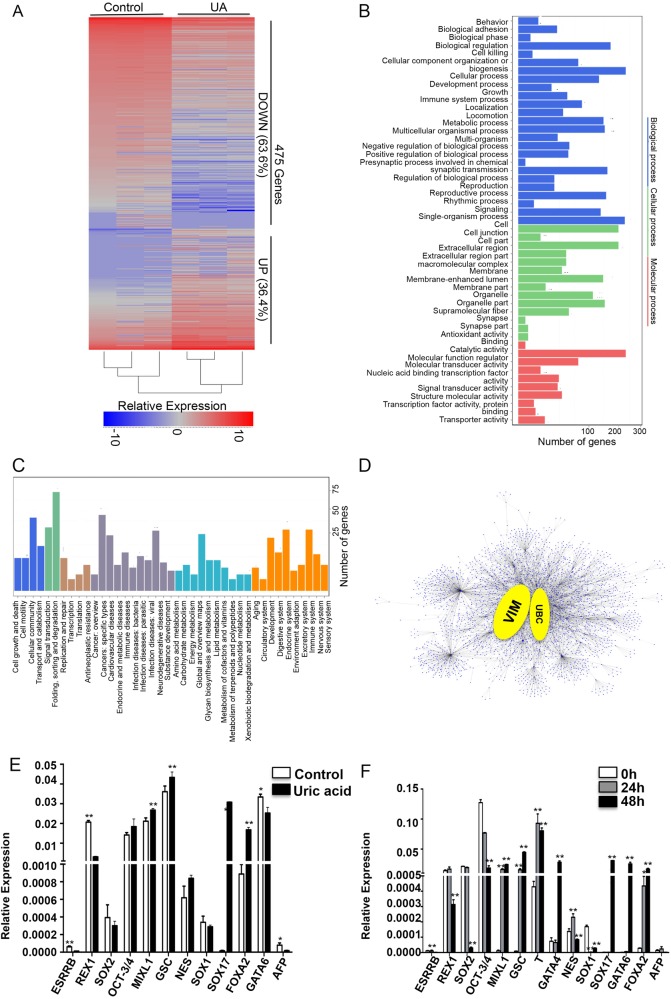
Fig. 5.
Analysis of transcriptional characteristics with or without UA treatment. a Heatmap shows hierarchical clustering of differentially expressed genes with or without UA treatment. Values are row-scaled to show relative expression. Blue and red are low and high levels, respectively. Representative down- (blue box) and upregulated (red box) genes are listed. b Gene ontology (GO) term categorization and distribution of differentially expressed genes. GO terms were processed and categorized under three main categories (cellular component, molecular function, and biological process). c KEGG pathway Rich detail figure. d Protein–protein Interaction Network of DEGs. e Quantitative PCR validation of certain DEGs, including the genes of pluripotent, endoderm, mesoderm, and ectoderm. f The expression of pluripotent, endoderm, mesoderm, and ectoderm were examined with quantitative PCR at UA treatment for 0, 24, and 48 h. n = 3 each. Data are expressed as means ± SD. *P < 0.05, **P < 0.01 vs. control

