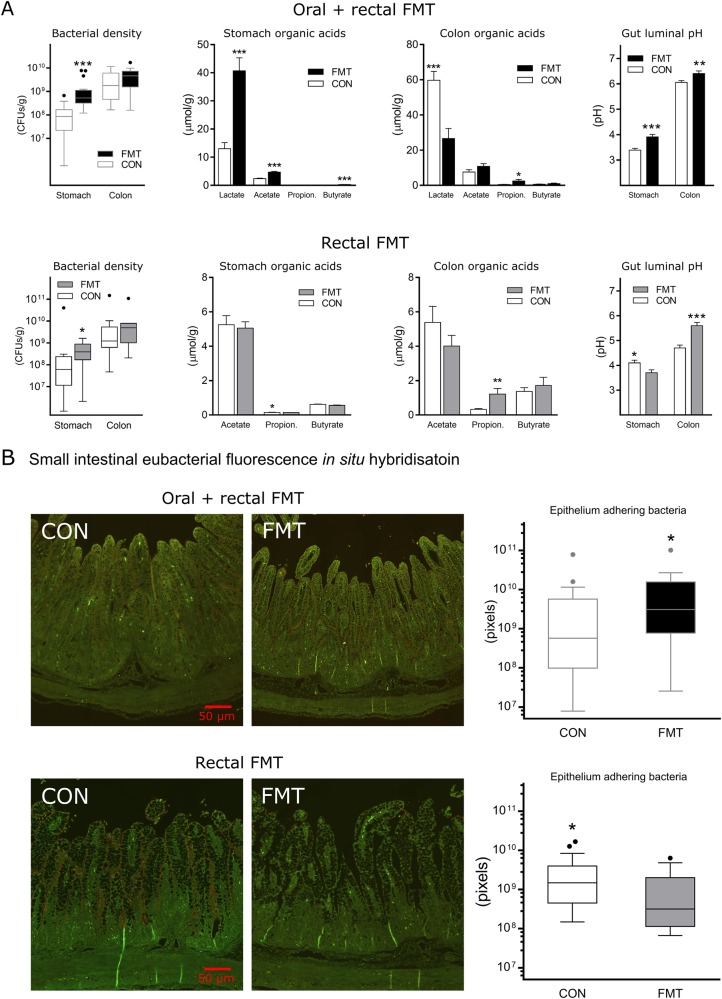
Fig. 3.
Gut microbiota metabolism and epithelial adhesion. a Left, gut bacterial densities quantified by qPCR. Center, organic acid levels in stomach and colon content. Right, acidity of stomach and colon luminal content. b Left, representative photomicrographs of fluorescence in situ hybridization stained (eubacterial probe, red fluorochrome signal) small intestinal tissue sections. Right, image analysis-based quantitation of mucosa bacterial adhesion on small intestinal tissue sections. Data are presented as median with interquartile range and statistical tests performed on log-transformed data. *p < 0.05, **p < 0.01, ***p < 0.001

