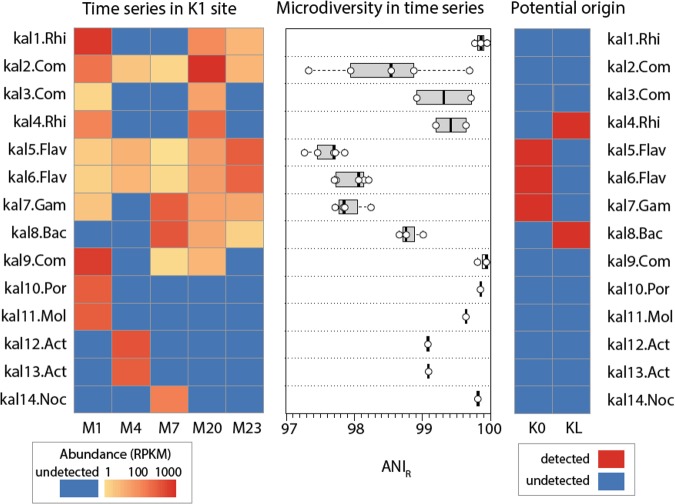
Fig. 2.
Abundance and sequence diversity of the identified bacterial populations (MAGs). The leftmost panel presents the abundance of the MAGs (rows) through time in samples (columns) from the K1 site as normalized coverage (Reads per Kbp per Million Reads, or RPKM). The middle panel shows the sequence diversity of the populations measured by ANIr for each of the time points (represented by open circles) where MAGs were detected ( > 1 RPKM). The rightmost panel denotes the potential origin of the each population based on their detection in the K0 (with drainage areas mostly representing mountainous forest regions) and KL (representative site of the urban area) sites. Presence (and thus, origin) was defined as coverage of the population by at least 100 RPKM in at least two time points from either the K0 or KL sites (M20, M23)

