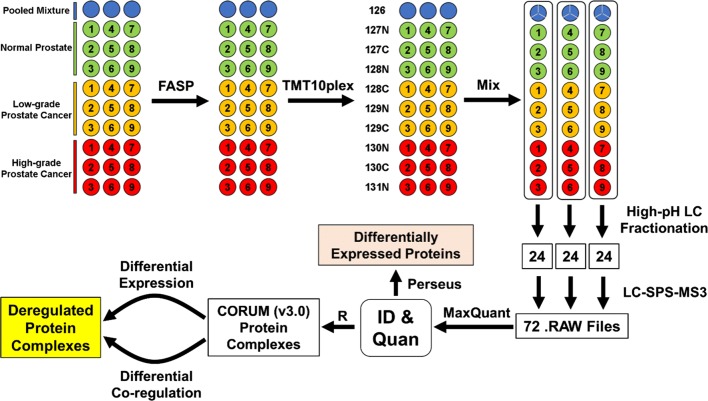
Fig. 1.
Workflow for quantitative proteomic comparison of three groups of prostate tissue specimens (i.e., normal control, low-grade PCa, and high-grade PCa) using TMT-SPS-MS3. A total of 30 OCT-embedded prostate tissue samples were digested in parallel into tryptic peptides by FASP, followed by chemical labeling with three sets of TMT10plex reagents. The three TMT126-labeled pooled mixture samples (shown as blue circles) were mixed and then equally divided into three portions (shown as blue circles divided into thirds). Differentially TMT10plex-labeled peptide samples were mixed into three groups (shown by the long rounded-rectangles), and then each set of TMT10plex mixture was fractionated by high-pH RPLC and concatenated into 24 fractions, so as to decrease peptide complexity and improve the detection of low-abundance proteins. Each fraction of TMT-labeled peptides was sequentially analyzed by LC-SPS-MS3. The acquired 72 RAW files derived from the three TMT10plex sets (24 fractions per set), which correspond to 30 individual samples, were analyzed by MaxQuant to identify and quantify proteins. Proteins quantified across all the 30 samples were a) analyzed by Perseus to identify differentially expressed proteins and b) mapped to CORUM (v3.0) protein complexes and subjected to differential expression and co-regulation analyses to identify in vivo deregulated protein complexes

