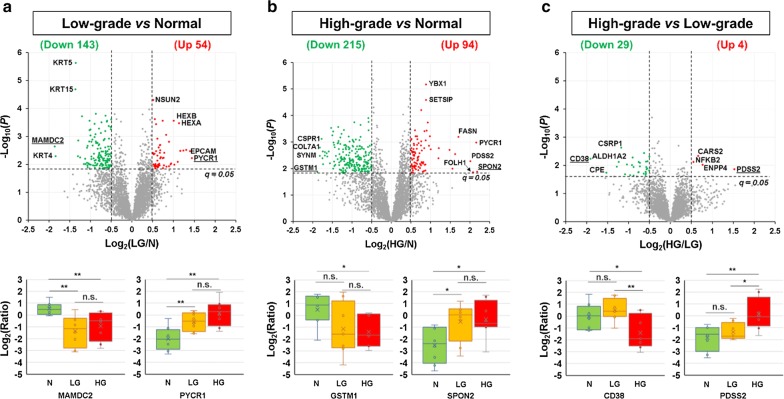
Fig. 2.
Identification of differentially expressed proteins between the N, LG, and HG groups. a Comparison of the N and LG groups. b Comparison of the N and HG groups. c Comparison of the LG and HG groups. The upper panels show the volcano plots of all the 3642 quantified protein groups. The lower panels show the boxplots for the most dramatically changed proteins in each comparison, whose names were underlined in the corresponding volcano plots. Here, the abbreviations N, LG, HG, and n.s. stand for normal prostate, low-grade PCa, high-grade PCa, and not significant, respectively. In the boxplots, **, *, and n.s. stand for p < 0.01, 0.01 ≤ p < 0.05, and p ≥ 0.05, respectively

