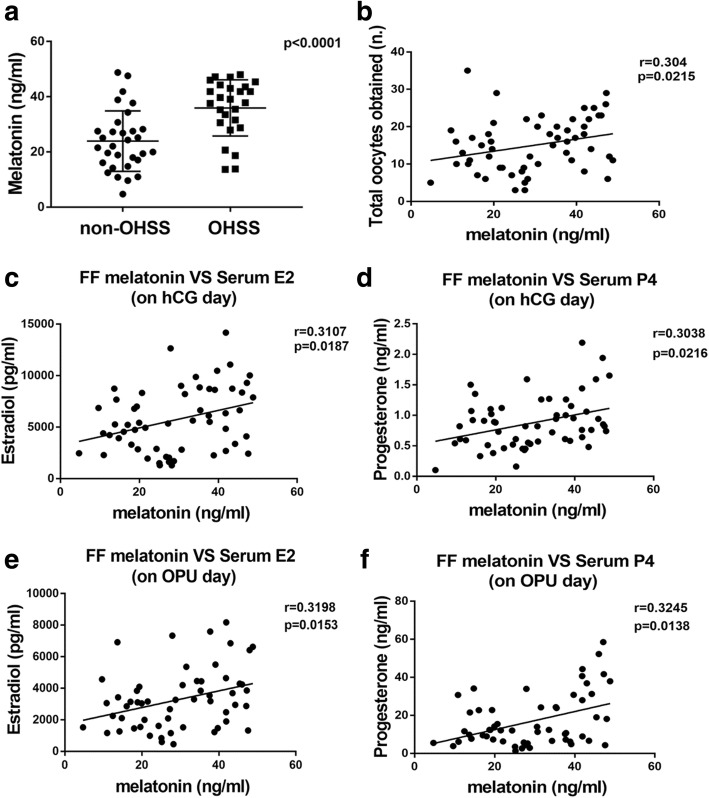
Fig. 1.
The difference of melatonin between OHSS and non-OHSS groups and the correlation with epidemiological parameters. (a): The difference of FF melatonin between the OHSS and non-OHSS groups(p < 0.0001). (b): Correlation between FF melatonin and the number of total oocytes obtained (r = 0.304; p = 0.0215). (c): Correlation between FF melatonin and serum E2 on the day of hCG administration (r = 0.3107; p = 0.0187). (d): Correlation between FF melatonin and serum P4 on the day of hCG administration (r = 0.3038; p = 0.0216). (e): Correlation between FF melatonin and serum E2 on OPU day (r = 0.3198; p = 0.0153). (f): Correlation between FF melatonin and serum P4 on OPU day (r = 0.3245; p = 0.0138)

