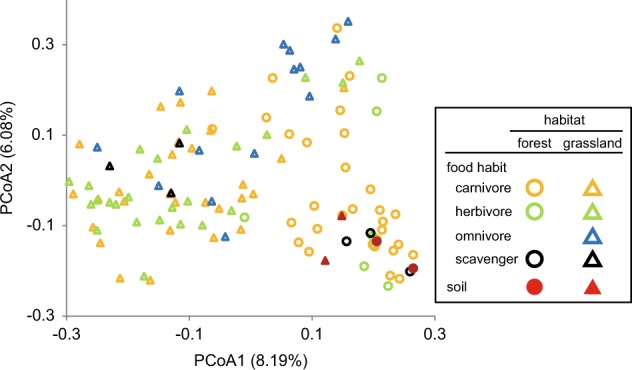
Fig. 5.

Fungal communities in beetle guts, clustered by using PCoA based on the unweighted Unifrac distance. Circles and triangles correspond to samples collected in forest and grassland, respectively, and are colored according to beetle food habits. Eigenvalues of PCoA1 and PCoA2 are shown in parentheses
