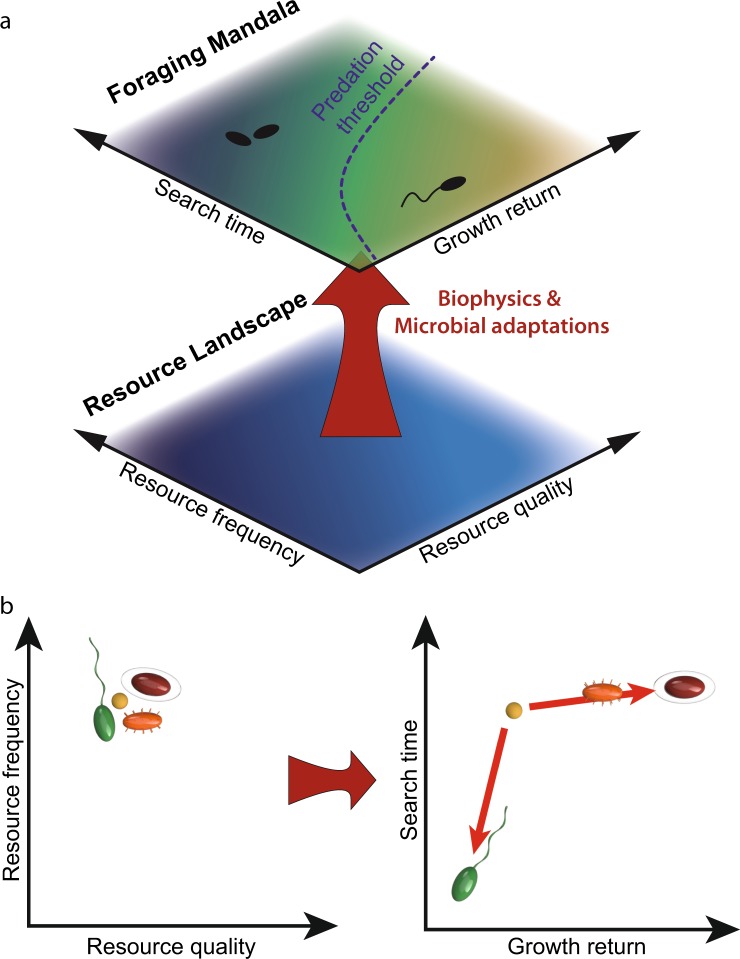
Fig. 1.
Schematic illustration of the foraging mandala for aquatic microorganisms. a The resource landscape (bottom plane), characterized in its simplest form by the frequency and quality of resource patches, is not the only determinant of foraging. Rather, biophysical processes and biological adaptations ‘map’ the resource landscape onto a foraging landscape – or foraging mandala (top plane). The latter consists of two axes – search time and growth return – that encompass foraging performance. The color-coding indicates how favorable a given condition is for microbial growth, with lighter colors corresponding to more favorable conditions (light blue in the resource landscape, yellow in the foraging mandala). b Organisms that inhabit the same resource landscape (same location in the resource landscape plane, at left) but have different foraging adaptations (planktonic – yellow; swimming – green; attaching – orange; attaching and biofilm forming – red) will occupy different regions in the foraging mandala (at right), representative of their different foraging performances in that resource landscape. For example, swimming reduces the search time and thus shifts the position on the mandala downward, while attachment and biofilm formation enhance the growth return and thus shift the position on the mandala rightward

