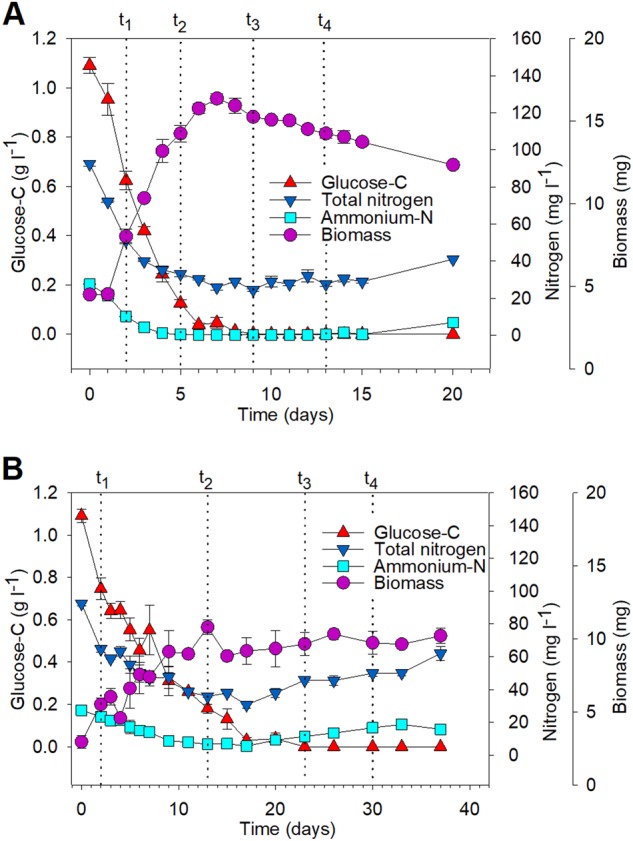
Fig. 1.

Mycelial biomass and chemical modifications of SOM extracts during decomposition by P. involutus (PAI) and L. bicolor (LAB). Dotted vertical lines indicate four time points (t1–t4) selected for spectroscopic and transcriptomic analyses. Changes in glucose-C, total N, ammonium-N, and the biomass of P. involutus (A) and L. bicolor (B) are shown (mean ± SE, n = 3). Note the different time-scales for the two fungi. Changes in the pH of the SOM extract are shown in Fig. S2B
