Fig. 2.

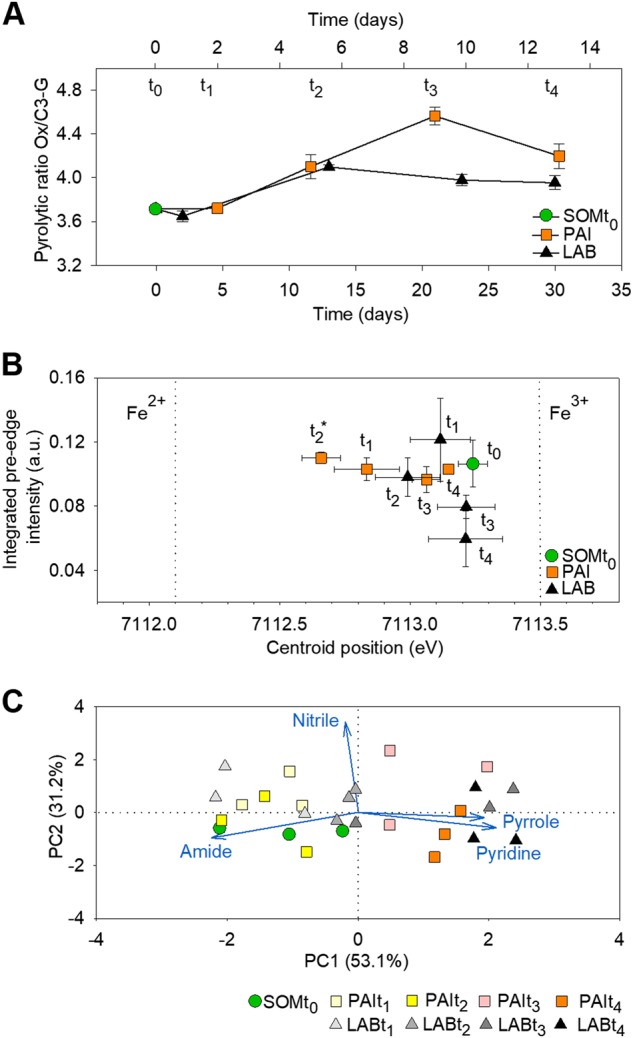
Lignin residue oxidation, iron speciation, and changes in organic N compound content. The time points t1–t4 are defined in Fig. 1. A Decomposition of lignin residues in the SOM extract, as determined by using pyrolysis-gas chromatography/mass spectrometry. The ratio of 4-acetylguaiacol to trans-propenylguaiacol (Ox/C3-G) is shown, as a marker of the degree of lignin side-chain degradation [13]. The data are corrected for the total organic C content and normalized to data for a SOM extract that had not been incubated with fungi (mean ± SE, n = 3). The top x-axis refers to the incubation time of P. involutus and the bottom x-axis refers to that of L. bicolor. B Changes in the speciation of iron in the SOM extract (mean ± SE, n = 2). Vertical lines indicate the centroid positions for ferric iron (Fe3+; at 7113.5 eV) or ferrous iron (Fe2+; at 7112.1 eV). The asterisk indicates significant difference from the initial SOM extract (SOMt0) (p < 0.05, one-way ANOVA). c The principal component analysis score and loading factor plot of the N K-edge spectra of the SOM extracts incubated with P. involutus and L. bicolor. The loading vectors were lengthened to improve the clarity of the figure
