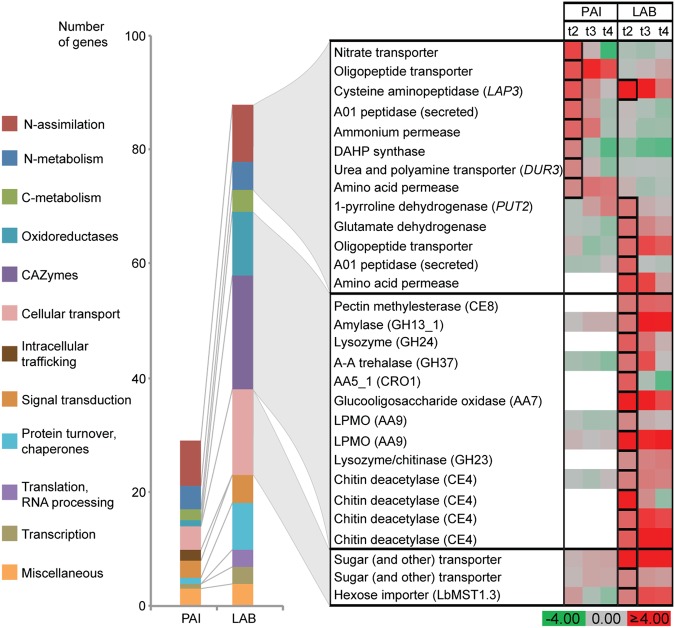
Fig. 3.
Expression of P. involutus (PAI) and L. bicolor (LAB) genes at the onset of SOM oxidation. The bar graph depicts the functional categories of annotated genes (29 in P. involutus and 88 in L. bicolor) that were among the top 20% most highly expressed genes at t2, and were upregulated more than twofold in pairwise t2 vs. t1 comparisons (n = 3, padj < 0.01, Wald test). The categories CAZymes and Translation, RNA processing were identified only in L. bicolor; Intracellular trafficking was only identified in P. involutus. Detailed information on the annotated genes is given in Tables S7 and S8. Fold-changes in expression for (t2–t4) vs. t1 comparisons, presented on a log2-scale, of selected genes from the N metabolism, N assimilation, CAZymes, oxidoreductases, and cellular transport categories are shown in the panel on the right. The t2 data points depicted in black squares indicate genes that were highly upregulated (≥twofold vs. t1) and expressed (top 20% at t2). Gene names given in parentheses in the N metabolism and N assimilation categories are homologs from S. cerevisiae that are significantly upregulated during ammonium limitation (Table S9). Procedures for identifying homologs of P. involutus and L. bicolor are described in Table S10; white color indicates that no homolog was identified

