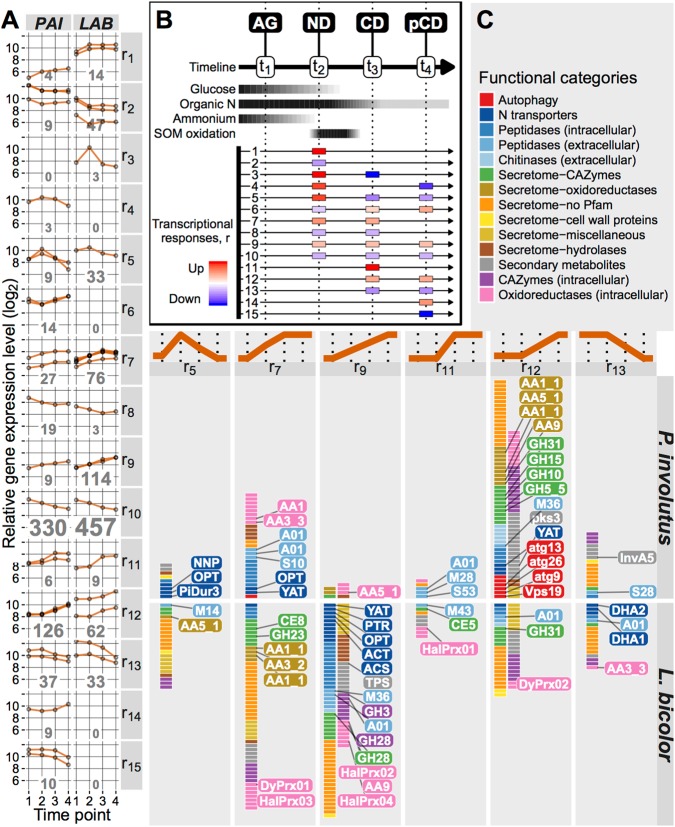
Fig. 4.
Transcriptional responses of ECM fungi to changing nutrient availability. A Main temporal gene expression profiles identified by clustering genes associated with metabolism and SOM-interaction, and differentially expressed in P. involutus (PAI, 1066 genes) and L. bicolor (LAB, 1120 genes) (Fig. S8). The main expression profiles were grouped into 15 distinct transcriptional response types (r1…r15) (panel B). The number of distinct genes within each response type category is indicated in each subpanel, with the font size proportional to the number of genes. B Identification of the transcriptional response types. Top, schematic representation of changes in glucose, organic N, ammonium-N, and SOM oxidation levels, determined by chemical analyses (cf. Figs. 1 and 2). AG active growth, ND ammonium depletion, CD glucose depletion, pCD prolonged glucose depletion. Bottom, observed patterns of qualitative changes in gene expression at the ND, CD, and pCD conditions relative to the preceding time point. These patterns were thus defining the 15 transcriptional response types. The response patterns are sorted according to the time point of expression change, prioritizing upregulation over downregulation, and positioning complementary pairs (up vs. down) next to each other. A missing box indicates a sustained expression level. C Genes clustered by virtue of their SOM-interaction annotation. Shown are the transcriptional response types that were specifically upregulated during ND (r5), upregulated during ND and CD (r7 and r9), sustained during ND and upregulated during CD and pCD (r11 and r12), and sustained during ND and downregulated during CD and pCD (r13). Functional gene categories are indicated by different colors and the boxes represent individual gene models. Genes discussed in the text are highlighted. See Dataset S1 for more detailed information

