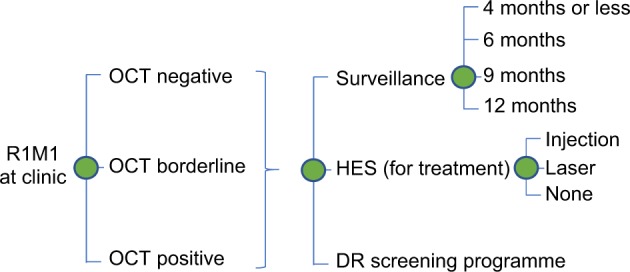
Fig. 1.

Model structure for individuals with R1M1 grading at SDOCT clinic appointment. The same model structure applies for R0M0, R1M0 and R2-R3 grading at SDOCT clinic appointment. The circles denote ‘chance’ nodes where branches meet (representing likely events) that set out the probability of an event occurring or not (e.g., OCT negative/borderline or positive given R1M1 grading at SDOCT clinic). The probabilities of events must always sum up to one at any given node. Costs were assigned to each branch including the end of the branch to value the resource use associated with each possible model pathway. These costs are combined with branch probabilities and the tree is ‘rolled back’ so that mean cost of the intervention can be estimated
