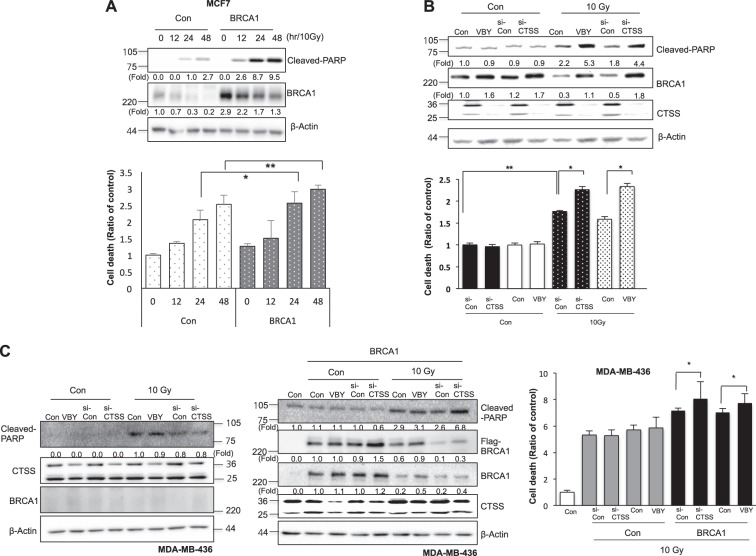
Fig. 7.
Inhibition of IR-mediated cell death by CTSS. a MCF7 cells were transfected with a control or WT-BRCA1. Western blots of cleaved-PARP and BRCA1 expression were performed (upper). Cell death was evaluated by PI staining after 12, 24, and 48 h of 10 Gy IR (bottom). b MCF7 cells were transfected with si-CTSS or were treated with VBY-036 (10 μM). Western blots of cleaved-PARP and BRCA1 expression were performed (upper). Prevalence of cell death was evaluated by PI staining after 48 h of exposure to 10 Gy (bottom). c MDA-MB-436 cells with or without WT-BRCA1 were treated with si-CTSS or VBY-036 (10 μM). After 48 h of 10 Gy IR, Western blotting (left) or PI staining (right) was performed. Protein levels were quantified using Image J software, and data are expressed as the fold change relative to the negative control. The graphs depict the mean ± SD of PI-positive cells. *p < 0.05 and **p < 0.01 (ANOVA)

