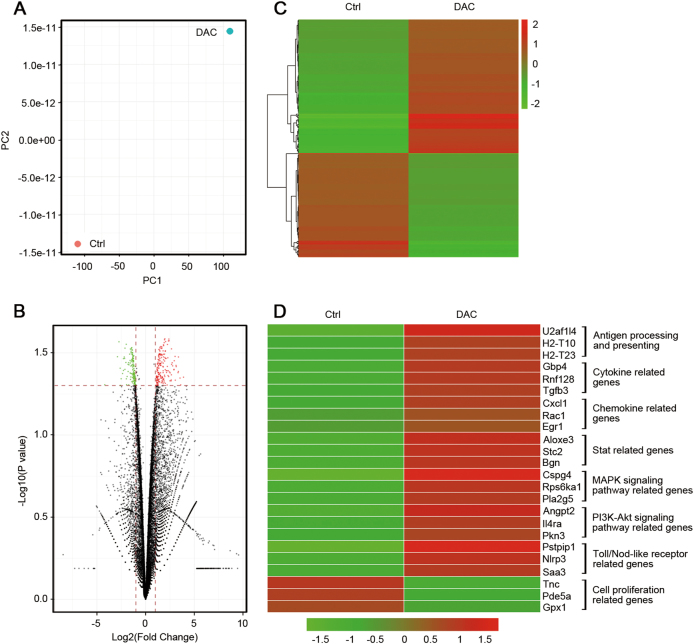
Fig. 3.
The effects of low-dose DAC on the CT26 cells. a Principal component analysis of the control and DAC-treated CT26 cells. A greater distance between the two points indicates a greater difference in the gene expression. b The volcano plots show the fold-changes (FC) and p-values for the comparisons between the control and DAC-treated CT26 cells. Differentially expressed genes (FC ≥ 2, p-value <0.05 with FDR, diffå 100) are displayed in red, and differentially expressed genes (FC ≤ 2, p-value <0.05 with FDR, diffå 100) in green. c Unsupervised hierarchical clustering of the control and DAC-treated CT26 cells. d Representative differentially expressed genes and their associated functions in the control and DAC-treated CT26 cells

