Fig. 2.
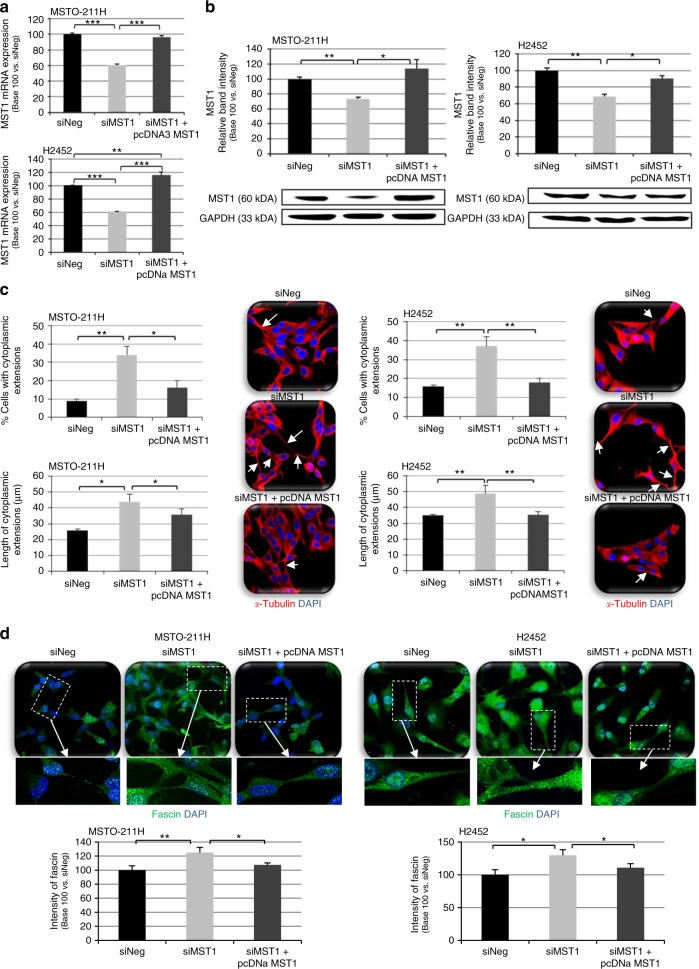
MST1 depletion causes morphological changes. a–d MST0-211H and H2452 cells were transfected with siNeg, siMST1, or siMST1+pcDNAMST1, analysed 48 h after transfection. Expression of MST1 was analysed by reverse transcription-quantitative real-time PCR (RT-qPCR) (a) and western blot (b), using glyceraldehyde-3-phosphate dehydrogenase (GAPDH) as an internal control. Quantification of number of cytoplasmic extensions and their size (µm) after α-Tubulin staining (c) and quantification of Fascin expression (d) by immunofluorescence and confocal microscopy in almost 200 cells using ImageJ software. Representative confocal pictures (c, d) are presented for cells stained for α-Tubulin (red), Fascin (green), and nuclei stained with 4′,6-diamidino-2-phenylindole (DAPI). For all histograms, error bars indicate the SEM of at least three independent experiments; *p < 0.05, **p < 0.01, and ***p < 0.001, using an analysis of variance (ANOVA) test followed by Dunnett’s test

