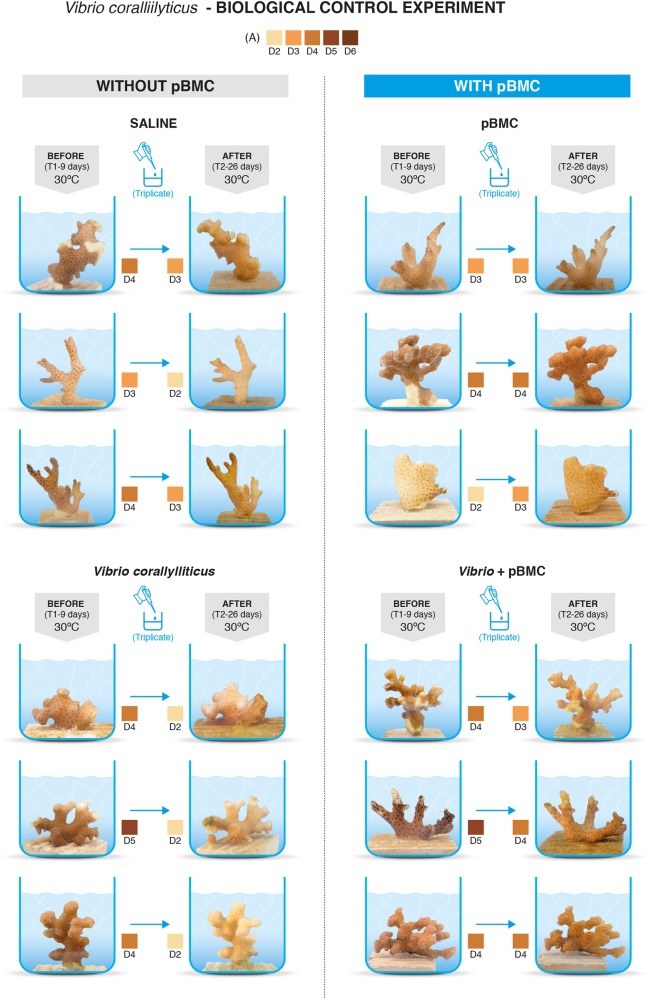
Fig. 2.
Comparative photos of the Pocillopora damicornis fragments at the beginning and at the end of the biological control experiment used in the following 4 treatments: saline (control (CTR), no pBMC inoculation) (n = 3), pBMC (pBMC inoculation) (n = 3), Vibrio coralliilyticus (VC inoculation), pBMC + VC (pBMC and VC inoculation). “Before” corresponds to each experiment initial time (Day 9 of experiment corresponds to the initial time control, i.e., peak of temperature and first inoculations were made or started at day 9). “After” corresponds to the end of the experiment (day 26). *original photographs are shown

