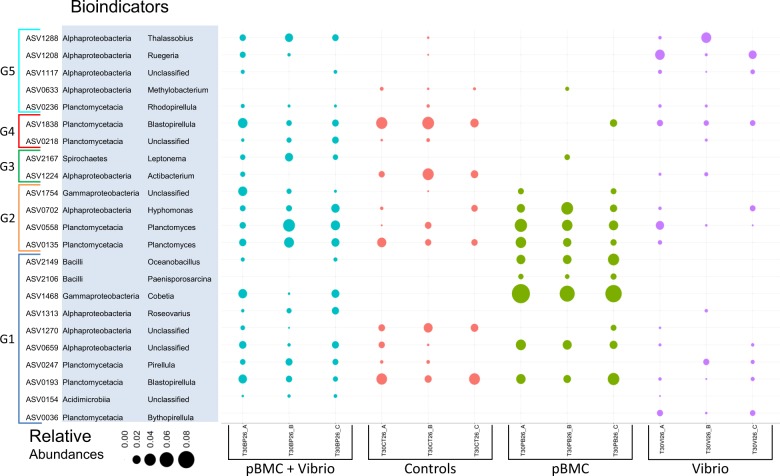
Fig. 5.
Relative abundance distribution of ASVs used as bioindicators in the different treatments (Controls, pBMC, pBMC + VC and VC) per sample. The size of the circles represent the relative abundances. We added colors to ASV relative abundances belonging to the same treatments. Class and genus of each ASVs are also shown in this figure. We grouped the ASVs in 5 different groups depending on how the different ASVs showed statistic differences (P < 0.5) in a False Discovery Rate test performed after a two way ANOVA using inoculation of pBMC and VC as factors. (G1) Statistically significant ASVs (P < 0.05) in the interaction pBMC:VC. (G2) Statistically significant ASVs (P < 0.05) in the interaction pBMC * (VC * pBMC:VC). (G3) Statistically significant ASVs (P < 0.05) in the interaction pBMC:VC * VC. (G4) Statistically significant ASVs (P < 0.05) in the interaction pBMC:VC * (VC * pBMC). (G5) Statistically significant ASVs (P < 0.05) in the interaction VC * (pBMC * pBMC:VC)

