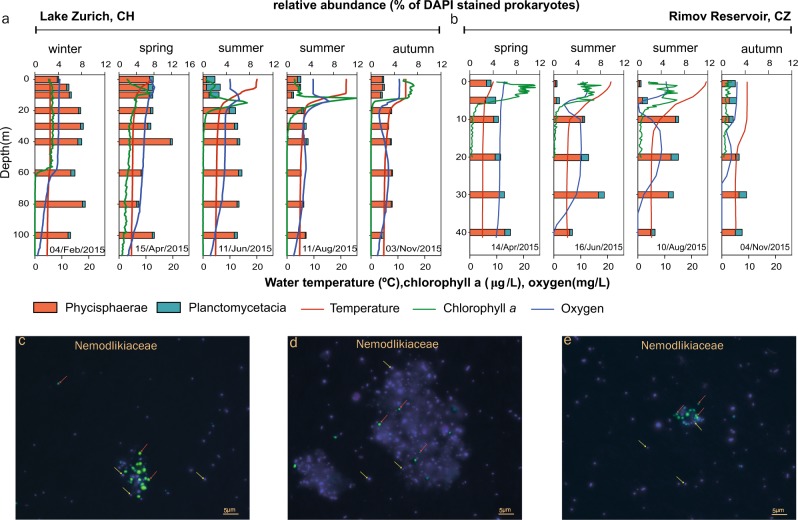
Fig. 4.
Spatio-temporal profiles of Planctomycetes relative abundance (horizontal bars), temperature (red line), chlorophyll a (green line) and oxygen (blue line) in Lake Zurich (a) and Rimov Reservoir (b) during 2015. The vertical axis shows the depth (m), within the water column, from which the samples were collected (9 for Lake Zurich and 6 for Rimov Reservoir). The upper X-axis shows the percentage of Phycisphaerae (red bars) and Planctomycetacia (dark cyan) within the prokaryotic communities (estimated as the total sum of DAPI-positive cells), while the lower one displays the values for temperature, chlorophyll a and oxygen. The sampling date is shown above the lower X-axis. c–e Display superimposed images of CARD-FISH-stained Planctomycetes (class Phycisphaerae, family Nemodlikiaceae) and DAPI-stained prokaryotes. The red arrows point towards free-living and particle-associated Planctomycetes, while the yellow ones designate unhybridized prokaryotic cells. The scale bar is 5 µm

