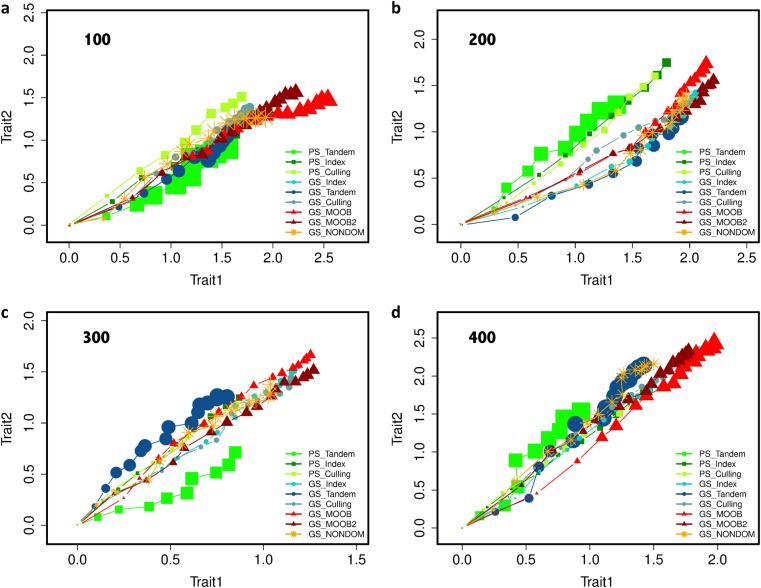
Fig. 5.
Simulations: the results from 30 replications of 16 rounds GS and 10 rounds PS with tandem, index selection (equal weights for traits) and independent culling, and 16 rounds with three multi-trait breeding methods. Breeding population sizes 100, 200, 300, and 400. Data points (in the trend lines) represent the improvement in Trait 1 and Trait 2 in consecutive breeding cycles. The changing sizes of points represents the variability of different breeding methods at each cycle over replicated trials of the experiment (30 reps) starting from the same initial population, the larger points corresponding to larger variances (the total variance of the mean breeding values obtained by a breeding method at a certain cycle calculated over the replications)

