
Fig. 2.
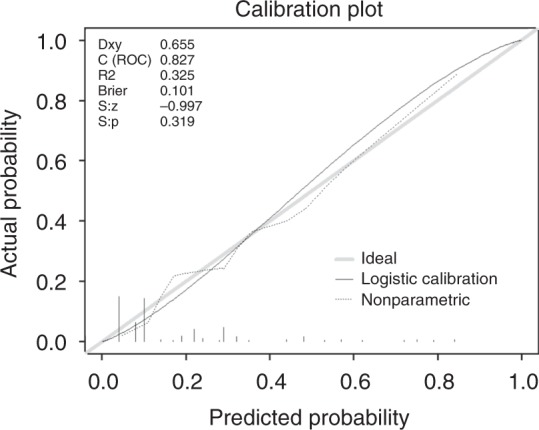
Calibration plot for external validation of the nomogram. Legend: Curves represent observed versus predicted probabilities, with gray line representing an ideal model (i.e., observed and predicted probabilities overlapping) and black and dotted lines representing the observed results. Brier Brier score, C (ROC) C-index, Dxy Somer’s D, S:p P-value of Spiegelhalter z-test, S:z z-value of Spiegelhalter z-test