Fig. 2.
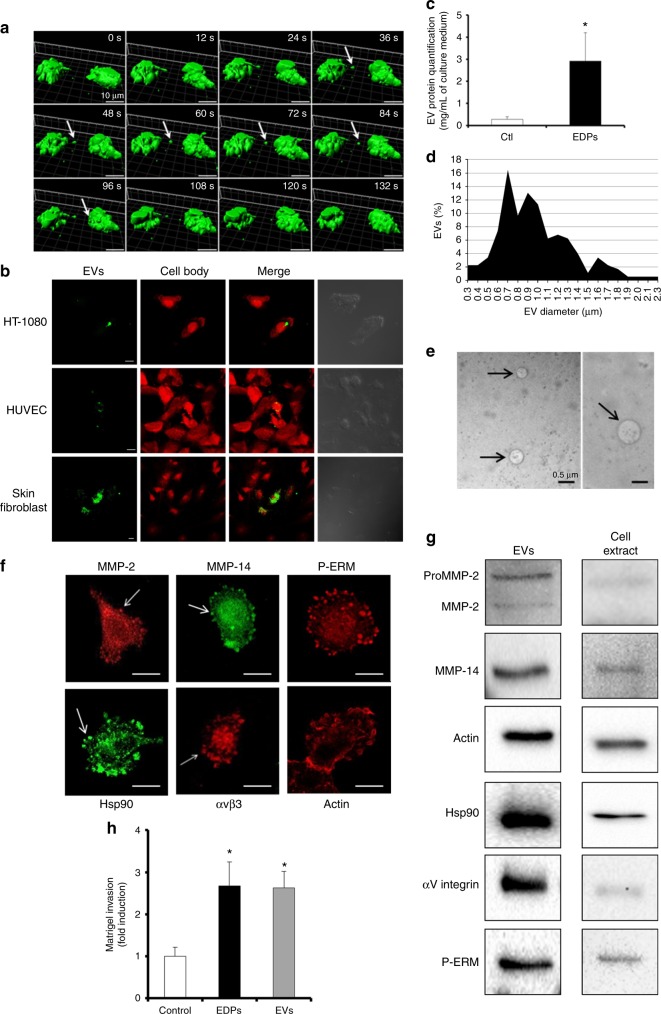
EDP-induced membrane blebbing leads to tumour extracellular vesicle shedding. a 3D Time-lapse snapshots of cell-to-cell communication between two blebbing cells in the presence of EDPs. Snapshot of 3D data was done using Imaris. White arrows indicate tumour shed extracellular vesicle. Scale bar: 10 µm. b Tumour extracellular vesicle binding and uptake by target cells. DiOC18(3) (green) stained EDP-dependent tumour shed extracellular vesicles were incubated for 6 h with modified calcein red-orange (red) staining tumour HT-1080 cells, HUVEC or human skin fibroblasts. Confocal imaging was realised to study the extracellular vesicle localisations. Scale bar: 10 µm c Extracellular vesicles were prepared from cell-conditioned medium by centrifugation and ultracentrifugation after 24 h of incubation. The extracellular vesicle (EV) protein content per mL of HT-1080 cell culture media in presence or absence of EDPs was measured by the Bradford micro-assay. Data are expressed as mean ± S.E.M. Values from five independent experiments, each performed in triplicate. *p < 0.05, significantly different from control. d Diameters of the isolated extracellular vesicles were measured by optical microscopy and expressed as a percentage of extracellular vesicles. e Structure of isolated extracellular vesicles (black arrows) visualised by transmission electron microscopy. The diameter of observed vesicles ranged from 300 to 700 nm. Scale bar: 0.5 µm. f Confocal microscopy analysis of MMP-2, MMP-14, P-ERM, Hsp90, αvβ3 integrin and actin in EDP-induced membrane blebs. White arrows indicate membrane blebs. Scale bar: 5 µm. g One microgram of extracellular vesicle (EV) proteins and 100 µg of cell extract proteins were analysed by western blot. h Quantification of Matrigel invasion by HT-1080 cells in presence of EDPs or extracellular vesicles (EVs) (amount of EVs corresponding to 1 µg of extracellular vesicle protein) after 6 h of incubation. Data are expressed as mean ± S.E.M. Values from three independent experiments, each performed in triplicate. *p < 0.05, significantly different from control

