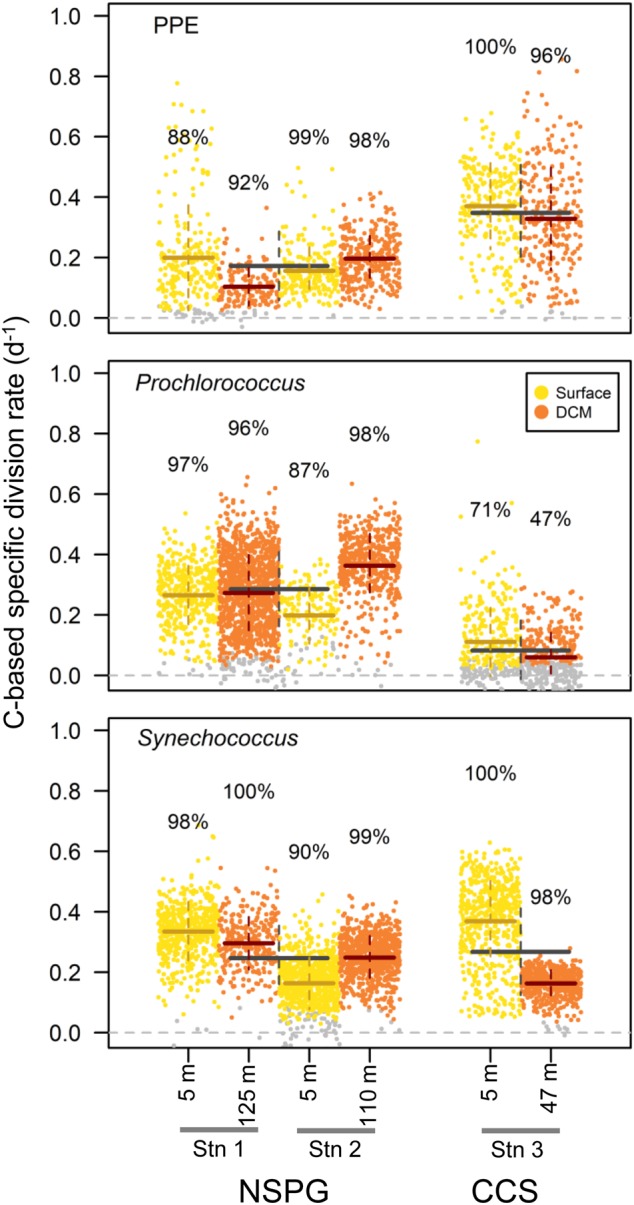
Fig. 3.

Whisker plot of C-based specific division rate (d−1) for each group (Prochlorococcus, Synechococcus, and PPE) in each daylight assay. Each dot represents an analyzed cell. Grey dots denote cells with rates not significantly different from zero. Colored lines denote mean division rates and standard deviations (plain horizontal and dashed vertical, respectively) in each assay. The percentages indicate proportions of detected active cells. Grey lines denote mean division rates and standard deviations (horizontal plain and vertical dashed, respectively) in the North Pacific Subtropical Gyre (NPSG) and in the California Current System (CCS) regions
