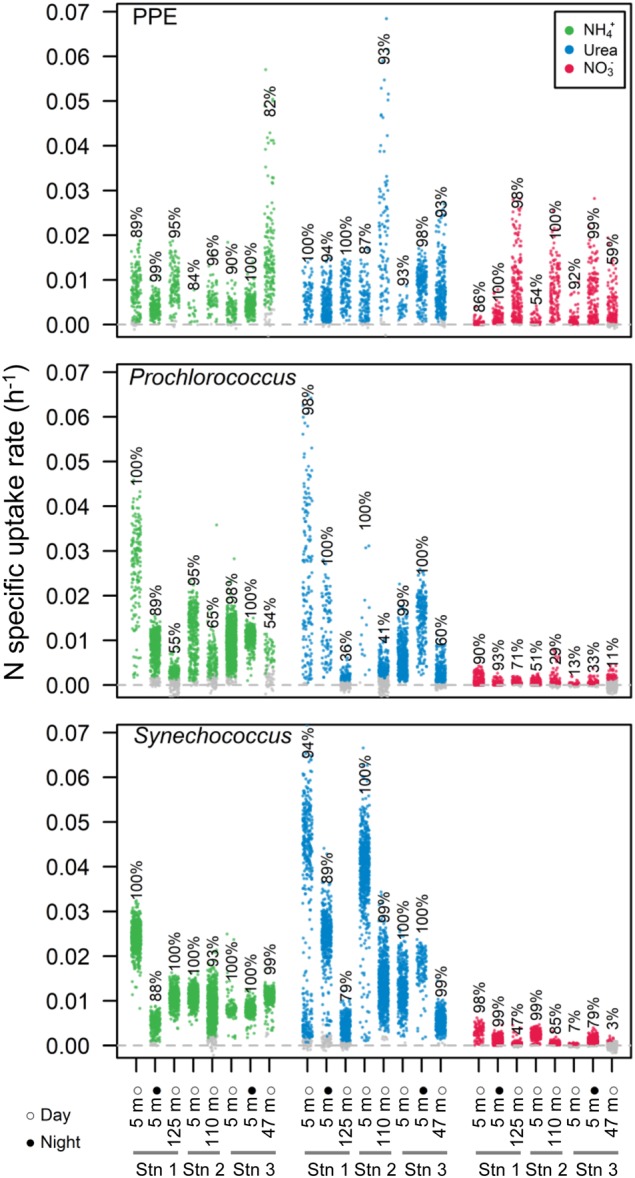
Fig. 4.

NH4+, urea, and NO3− specific uptake rates (h−1) of photosynthetic picoeukaryotes (PPE), Prochlorococcus, and Synechococcus in each assay. Each dot represents an analyzed cell. Colored and grey dots denote cells with detected and undetected activities, respectively. The percentages are the proportions of detected active cells in each assay
