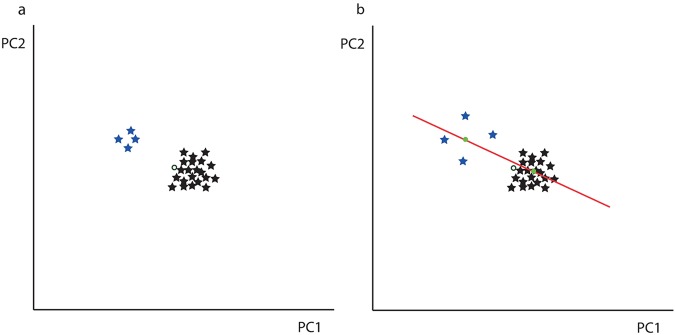
Fig. 1.
DA correction of the FA measure. a Unbalanced genetic sampling between two different genotypes (blue and black). The mean population (unfilled circle) is next to the black (larger) population. The effect of genotype on the variance from the mean population to the black population is therefore systematically smaller. b The red line represents a linear model of the genotype on the asymmetric component. Residuals from the means for each population (green dots) can be considered FA measures. This approach, applied in the study, removes the signal created by unbalanced sampling

