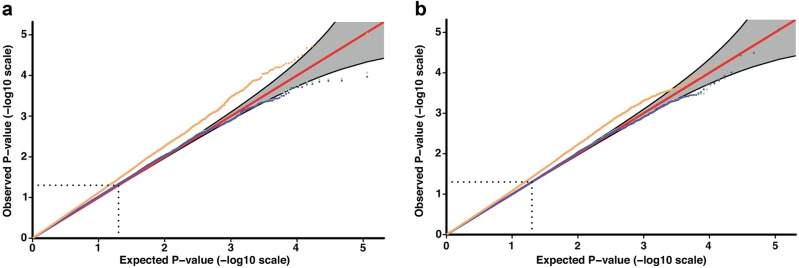
Fig. 2.
Quantile-quantile (QQ) plots for the datasets in the study of additive and dominant associations. The correction for population structure (green) does not influence the raw Procrustes data (violet) (r > 0.99). Procrustes distances corrected for DA (orange) are not influenced by the population structure either (not shown; r > 0.99). Raw and DA-corrected Procrustes distances are also highly related (r > 0.87). No significant marker is identified with either of the datasets. a QQ plot for additive effects. b QQ plot for dominant effects

