Fig. 2.
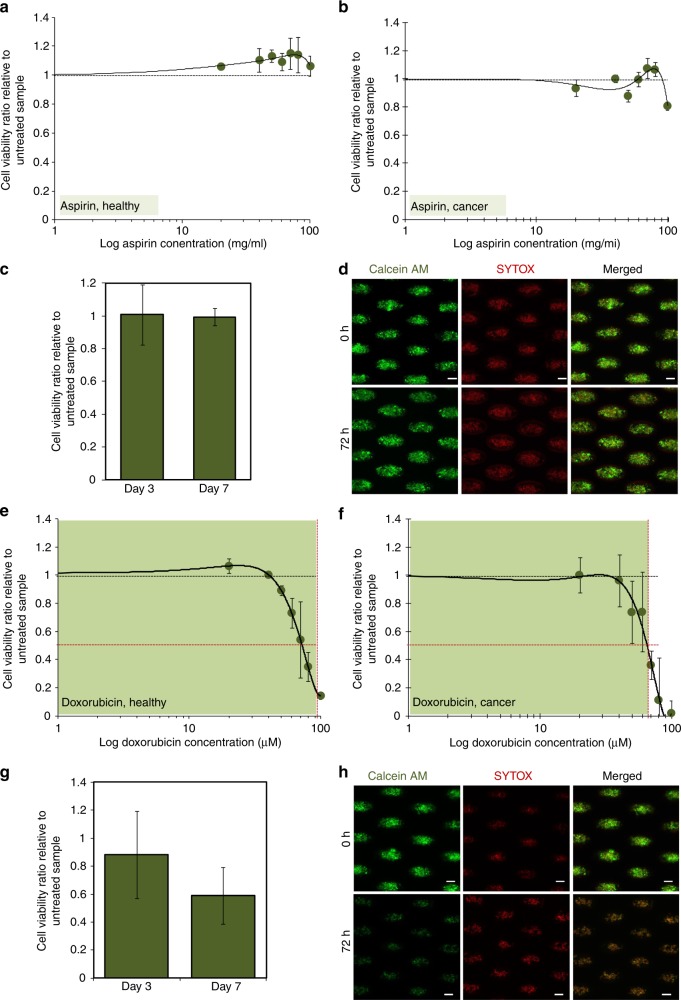
Assay outcome for single drug exposure using aspirin or doxorubicin. Viability ratios of a healthy and b MDA-MB-231 cancer cell cultures after 72 h drug exposure under the different percentage of aspirin concentrations (0–200 mg/ml), relative to averaged viability percentage of untreated cultures (i.e., 0 mg/ml aspirin concentration). Blood cells and cell lines serve as controls for components of the clinical patient samples, mainly white blood cells and cancer cells, respectively. Black dotted reference line indicates the averaged viability of the vehicle groups.(c Viability rates remained relatively constant after 72 h or 7 days of exposures to 250 mg/ml aspirin. d Representative images of live/dead staining of untreated cluster cultures (top) and cultures after 72 h treatment (bottom). Scale bar is 100 µm. The viability ratio of e healthy and f MDA-MB-231 cancer cell cultures after 72 h drug exposure with different percentage of doxorubicin concentrations alone, relative to averaged viability percentage of untreated cultures (i.e., 0 µM doxorubicin concentrations). The inhibitory concentration at 50% viability (IC50) values (horizontal dotted line) was obtained based on the corresponding drug concentration value that reflected 50% cell viability as indicated on the graphs by the vertical dotted lines (healthy cultures: 0.84 µM; cancer cell culture: 0.75 µM). Green regions show the concentrations selected for evaluation of long-term cultures for subsequent drug experiments. Black dotted reference line indicates the averaged viability of the vehicle groups. g Viability decreases after prolonged exposure to 0.5 µM doxorubicin. p = 0.189, with respect to differences in cell viability for cultures treated with doxorubicin only for 7 days and 72 h. h Representative images of live/dead staining of untreated cluster cultures (top) and cultures after 72 h treatment (bottom). Scale bar is 100 µm

