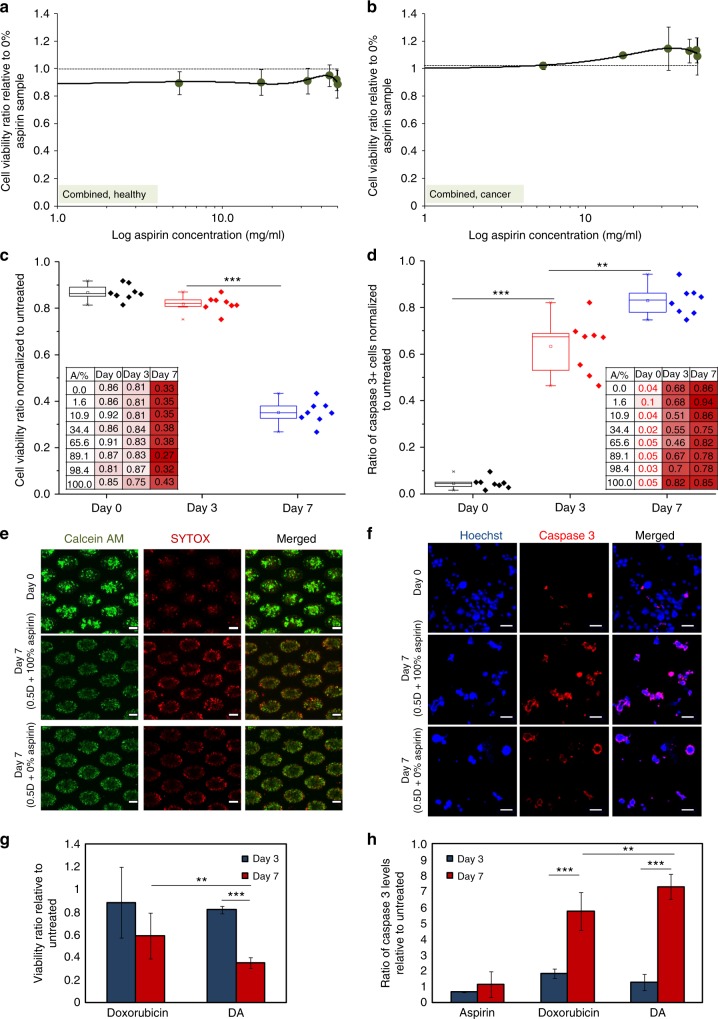
Fig. 3.
Viability rates under Combinatorial DA treatment administration. The viability ratio of a healthy and b MDA-MB-231 cultures after 72 h drug exposure to combinatorial DA treatment with different concentrations of aspirin only and fixed concentrations of doxorubicin at 0.5 µM (0.5 D), relative to the averaged viability percentage of cultures treated only with 0.5 D. Black dotted reference line indicates the averaged viability of the vehicle groups. c Viability ratio decreases after prolonged exposure to combinatorial DA treatment. Viability proportion varied with aspirin concentration under combinatorial therapy (inset). ***p < 0.00001. d The proportion of apoptotic cells (caspase-3 positive) increases after prolonged exposure to combinatorial DA treatment. Viability proportion varied with aspirin concentration under combinatorial therapy (inset). ***p < 0.00001, **p < 0.01. e Representative images of cancer cell clusters stained with live/dead dyes of untreated cluster cultures (top) and cultures after 72 h treatment (bottom). Scale bar is 100 µm. f Representative images of resuspended single cells from cluster cultures, stained with Caspase-3 antibody and nuclei dye. Scale bar is 20 µm. Killing efficacies of drug treatment with doxorubicin alone and combinatorial DA treatment via g comparison of viable cell proportions and h comparison of Caspase-3+ cell proportions. ***p < 0.00001, **p < 0.01

