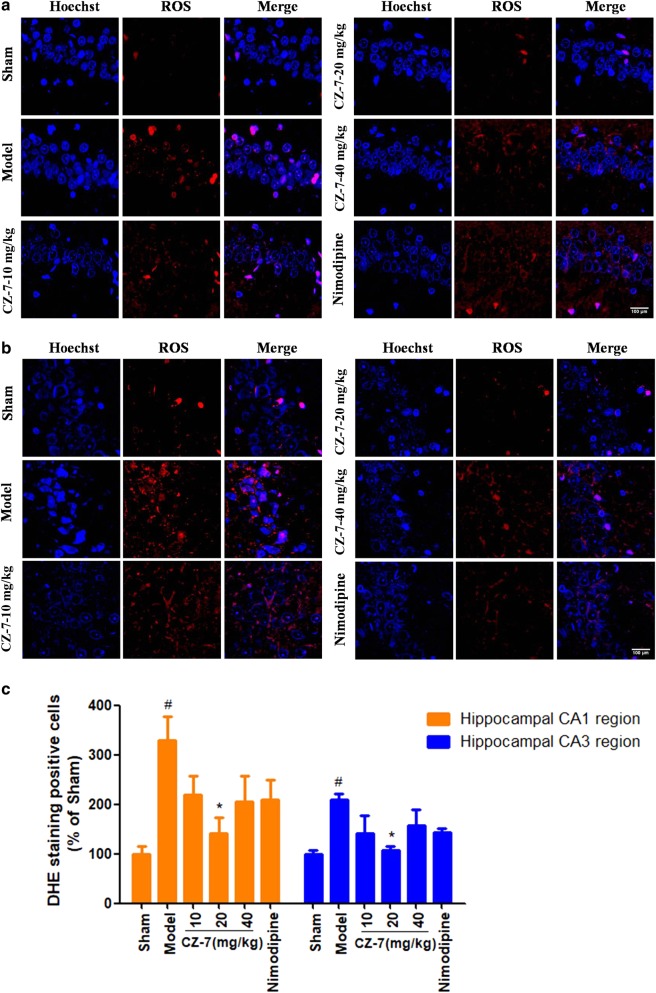
Fig. 8.
a, b The effects of CZ-7 on ROS changes in hippocampal CA1 and CA3 region induced by chronic cerebral hypoperfusion in rats. Representative micrographs: ×200 magnification, scale bar = 100 μm. c Quantification of CZ-7 effect on ROS-positive cells. Values are expressed as mean ± SEM. n = 3. #P < 0.05 vs. Sham group. *P < 0.05 vs. Model group. For CA1, one-way ANOVA, F (5, 17) = 3.841, P = 0.0261. For CA3, one-way ANOVA, F (5, 17) = 3.411, P = 0.0379

