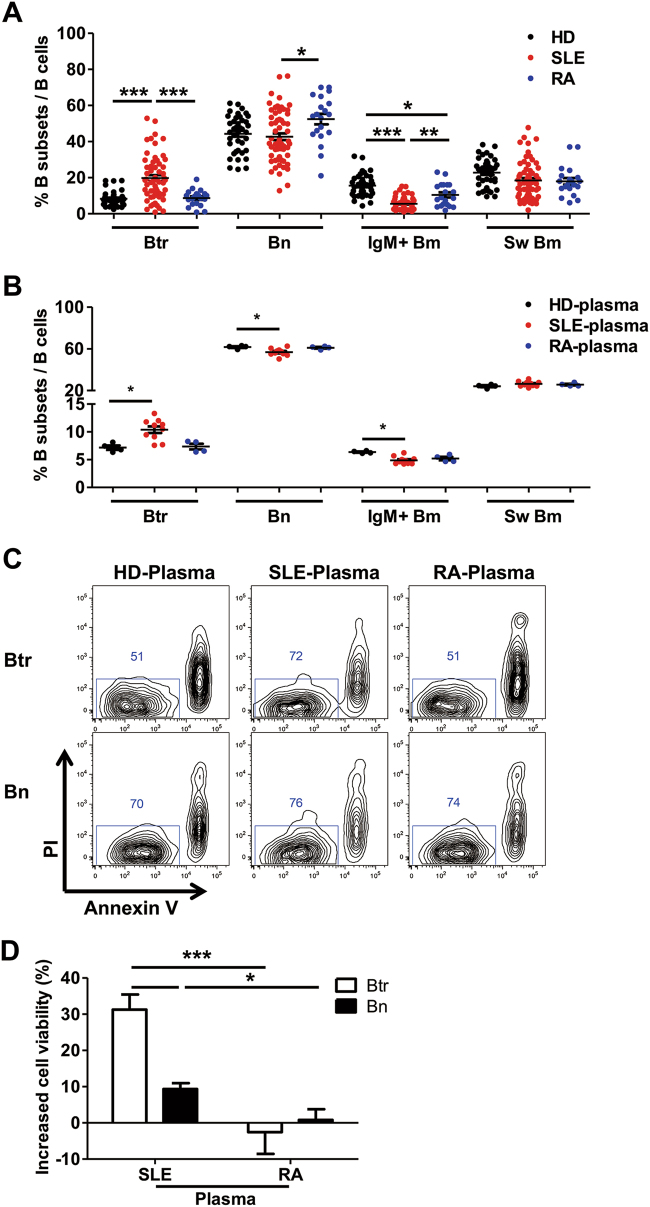
Fig. 1. Plasma from SLE patients protects transitional B cells from apoptosis.
a Scatter plots show the percentages of different peripheral B-cell subsets from 40 healthy donors (HDs), 64 SLE patients and 20 RA patients. b–d Purified B cells from healthy donors were cultured with 25% plasma from 4 HDs, 11 SLE patients or 4 RA patients for 24 h. b Scatter plots show the percentages of different B-cell subsets among PI− annexin V− live B cells after different plasma treatment. c Representative flow cytometry plots show the survival of Btr and Bn cells cultured with different plasmas. d Bar plot shows the increased cell viability of Btr and Bn with SLE or RA plasma treatment after normalization to HD plasma. Data are represented as means ± SEM (a, b, d) and are representative of three experiments (b–d). Data were analyzed by the Kruskal–Wallis test with post hoc analysis by Dunn’s multiple comparison test (a, b) and two-way ANOVA with Bonferroni correction for multiple comparisons (d). *P < 0.05, **P < 0.01, ***P < 0.001

