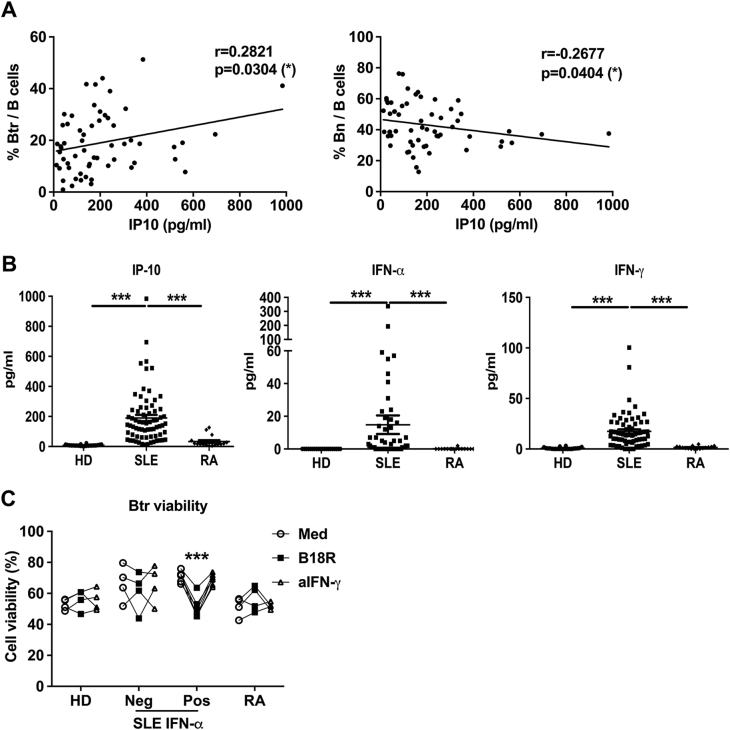
Fig. 2. SLE plasma enhances Btr cells survival in a type I IFN-dependent manner.
a Scatter plots show the correlation between the frequency of Btr or Bn cells and IP-10 concentration in plasma from 64 new-onset SLE patients, with the correlation analyzed with Spearman’s rank correlation. b Scatter plots show IP-10, IFN-α and IFN-γ levels in plasma from 22 HDs, 64 new-onset SLE patients and 16 RA patients. c Plasma from 4 HDs, 11 SLE patients (Neg: IFN-α was undetectable (4 patients); Pos: IFN-α was detectable (7 patients)), or 4 RA patients was pre-treated with medium, B18R or anti-IFN-γ antibody for 30 min at 4° C. Then, purified B cells from healthy donor were cultured with 25% pre-treated plasma. In addition, after 24 h, PI and annexin V were used to detect their survival. Scatter plots show Btr cell viability after different pre-treated plasma treatment. Data are represented as means ± SEM (b) and are representative of three experiments (c). Data were analyzed by the Kruskal–Wallis test with post hoc analysis by Dunn’s multiple comparison test (b), and two-way ANOVA with Bonferroni correction for multiple comparisons (c). *P < 0.05, ***P < 0.001

