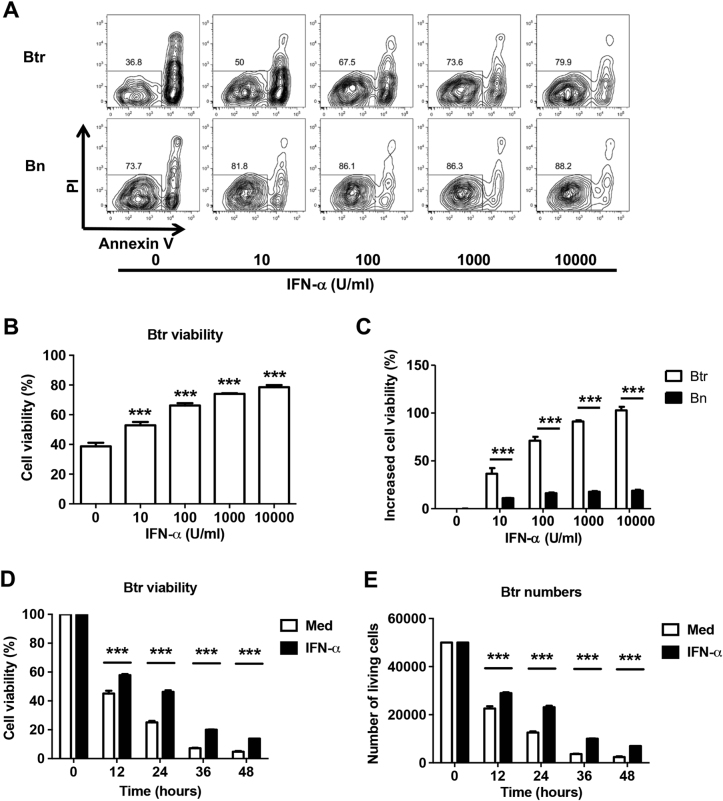
Fig. 3. IFN-α protects Btr cells from spontaneous apoptosis.
a–c Purified B cells from healthy donors were cultured with increasing concentrations of IFN-α for 24 h, and PI and annexin V were used to detect their survival. Representative flow cytometry plots (a) and cumulative data (b) show Btr cell viability. c Bar chart shows the increase in Btr and Bn cell viability with increasing doses of IFN-α normalized to medium alone. d, e Btr cells were sorted from HD B cells, then cultured with or without 1000 U/ml IFN-α. Bar charts show Btr cell viability (PI/Annexin V staining) (d) and viable cell numbers [trypan blue method] (e) at different time points. b–e Data are presented as means ± SEM and are representative of at least three experiments. Data were analyzed by one-way ANOVA with post hoc analysis by Dunnett’s multiple comparison test (b) and two-way ANOVA with Bonferroni correction for multiple comparisons (c–e). ***P < 0.001

